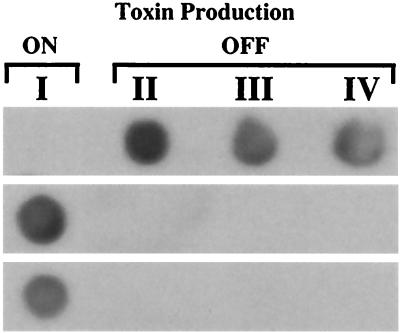
FIG. 4.
RNA dot blot analysis confirming the induction of DD bands A, B, and C (shown from top to bottom) in A. fundyense. Total RNA (10 μg per dot) corresponding to four equivalent sampling points (I through IV; Fig. 1) on the 24-hour cycle immediately following the cycle analyzed by DD was hybridized with cDNA probes generated by PCR of cloned cDNA fragments obtained from the DD gels (see Results).

