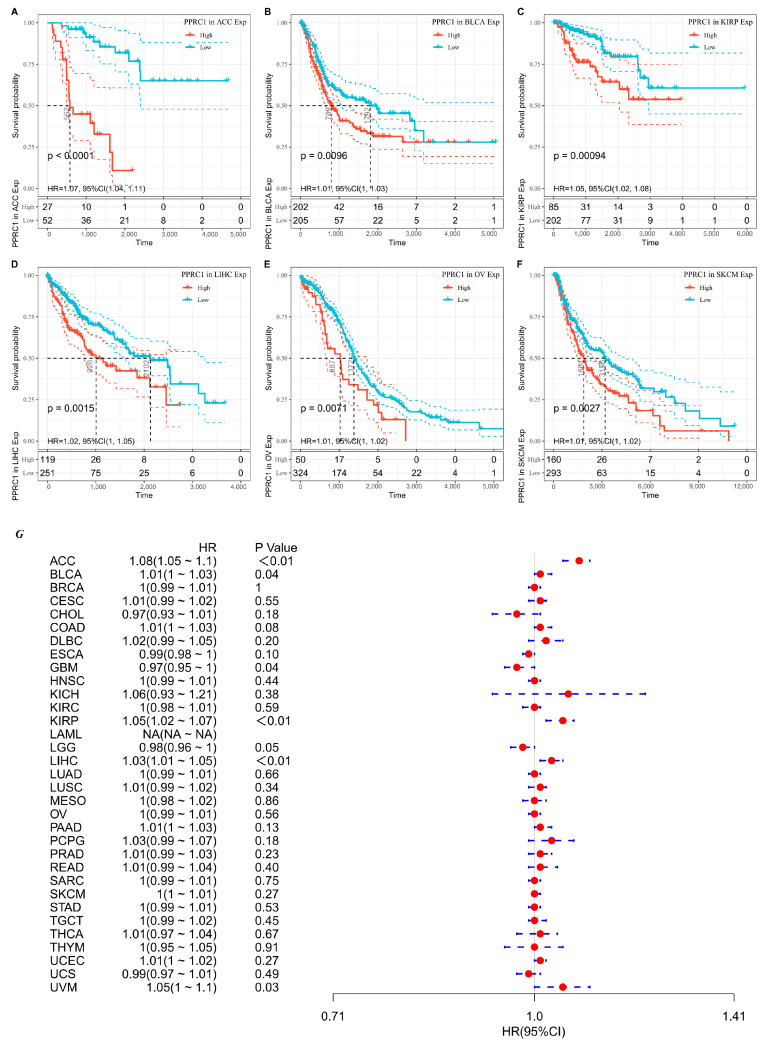
Figure 2.
The association of PPRC1 with OS. Kaplan–Meier-plotted survival analysis of different expression levels of PPRC1 from the TCGA database. The OS of ACC (A), BLCA (B), KIRP (C), LIHC (D), OV (E), and SKCM (F) in patients with higher or lower PPRC1 expression. The forest plot shows the hazard ratios of PPRC1 in pan-cancer (G).

