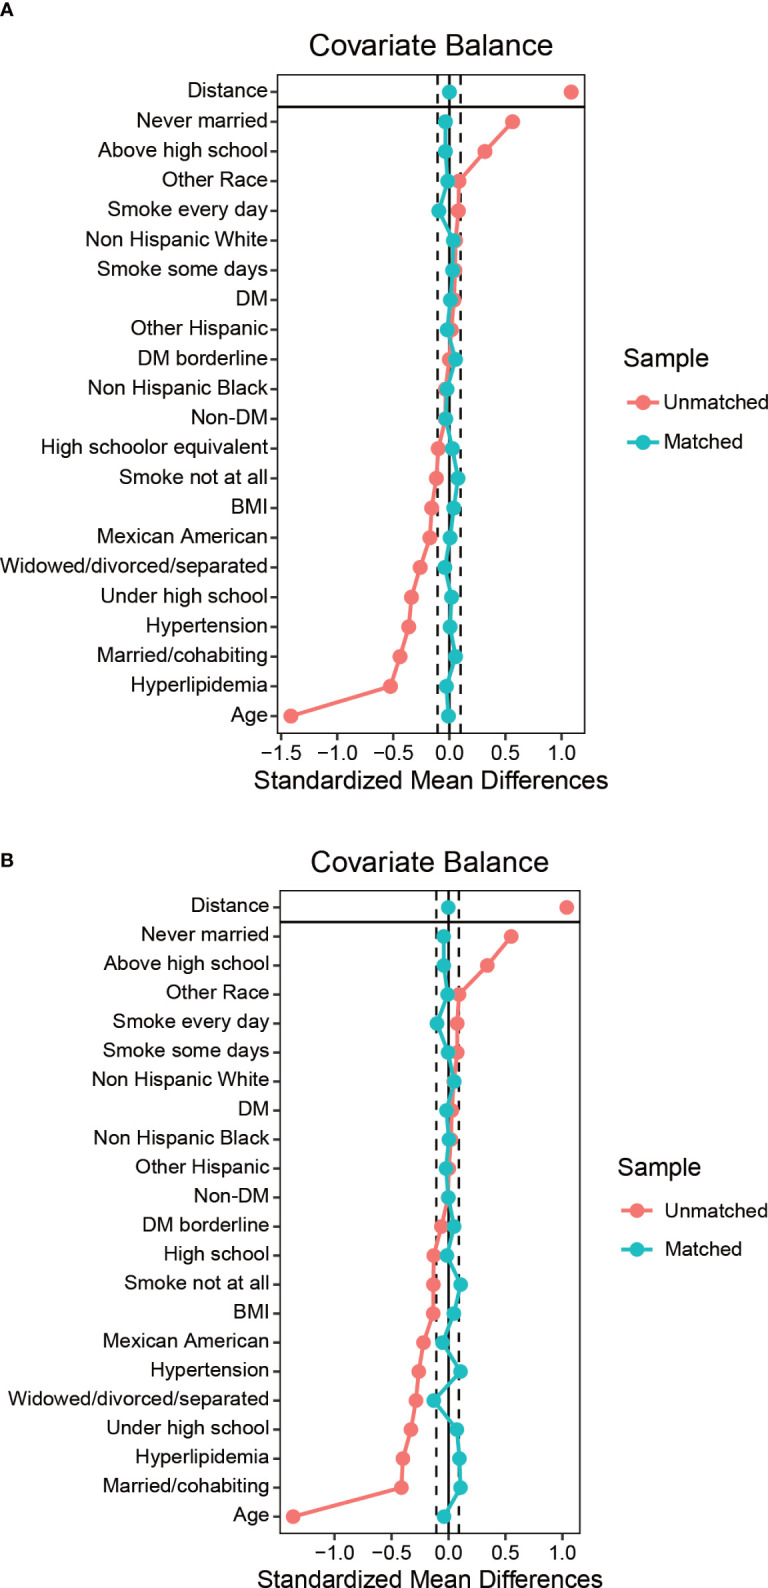
Figure 4.

Balance diagnostics plot for HPV immunization data, before and after matching. (A) Standardized differences shown for each baseline confounder variable of HPV immunization cohort before weighting. (B) Standardized differences shown for each confounder variable of HPV immunization cohort after weighting. Vertical dotted lines indicate the desired balance level. The X-axis represents the standardized differences value, and the Y-axis represents baseline variables. HPV, Human papillomavirus; BMI, body mass index; DM, diabetes mellitus.
