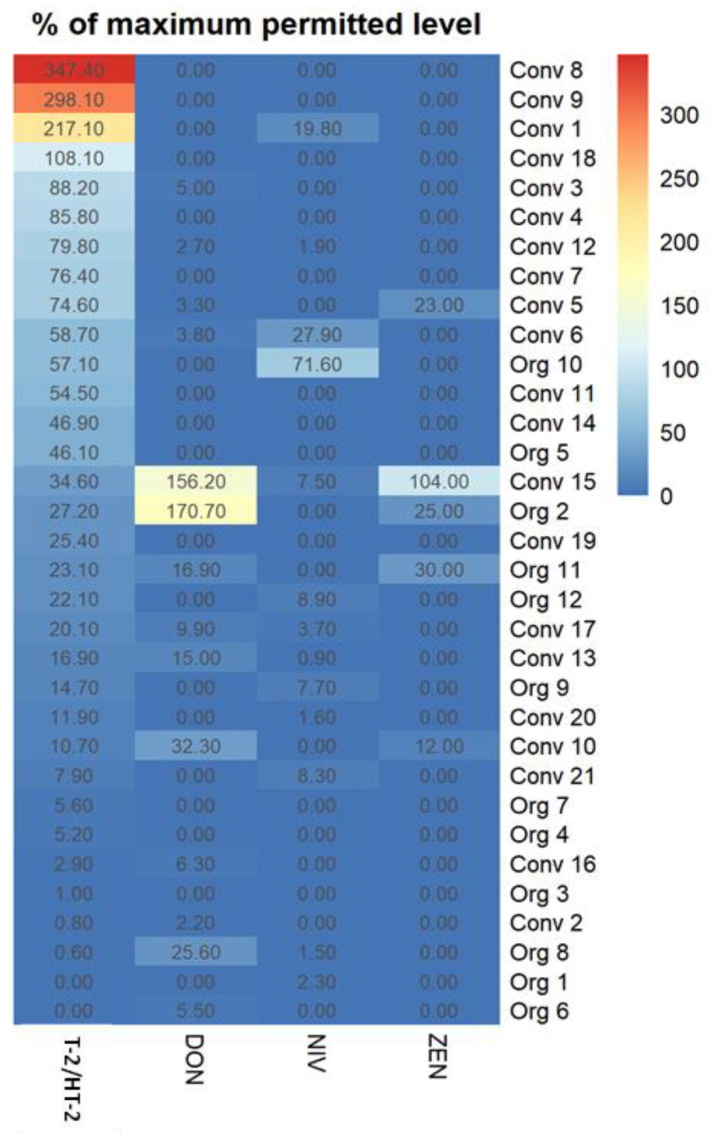
Figure 3.
Heatmap depicting co-occurrence of multiple free mycotoxins in individual oat samples. Mycotoxin levels are expressed as % of the EC indicative level for T-2/HT-2, % of the EC maximum permitted level for DON (used for DON and NIV), and % of the EC maximum permitted level for ZEN in unprocessed oats (Table 1). The heatmap was generated in “R” [version 4.2.1 (2022-06-23)], Org = organic oat sample, conv = conventional oat sample.

