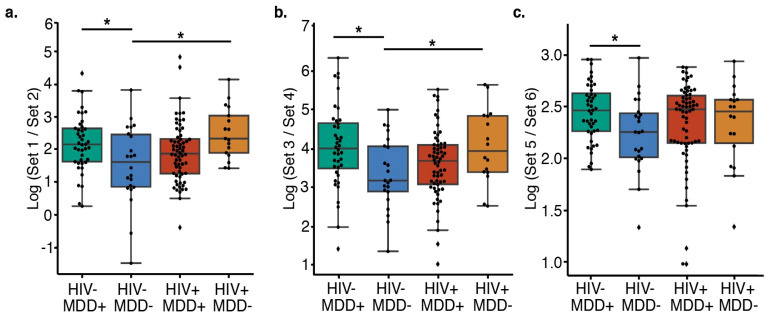
Figure 1.
Comparison of the relative abundance of the taxa using log ratios of the ranked taxa sets in different subgroups. (a) Features distinguishing PWH from PWoH (t-test, HIV−/MDD− versus HIV−/MDD+ Cohen’s D = −0.63, BH-corrected p = 0.023; HIV−/MDD− versus HIV+/MDD− Cohen’s D = −0.95, BH-corrected p = 0.020) and (b) features distinguishing MDD+ from MDD− (t-test, HIV−/MDD− versus HIV−/MDD+ Cohen’s D = −0.70, BH-corrected p = 0.038; HIV−/MDD− versus HIV+/MDD− Cohen’s d = −0.75, BH-corrected p = 0.043). (c) HIV-/MDD- have a lower ratio of LPS producers than HIV−/MDD+ (Cohen’s D = −0.66, BH-corrected p = 0.028). (a–c) Center lines represent the mean, the top of the box represents the upper quartile, the top whisker represents the maximum value (excluding outliers), the bottom of the box represents the lower quartile, and the lower whisker represents the minimum value (excluding outliers). * Indicates significant differences (BH-corrected p < 0.05) between groups. The list of features in each set are present in Table 2.

