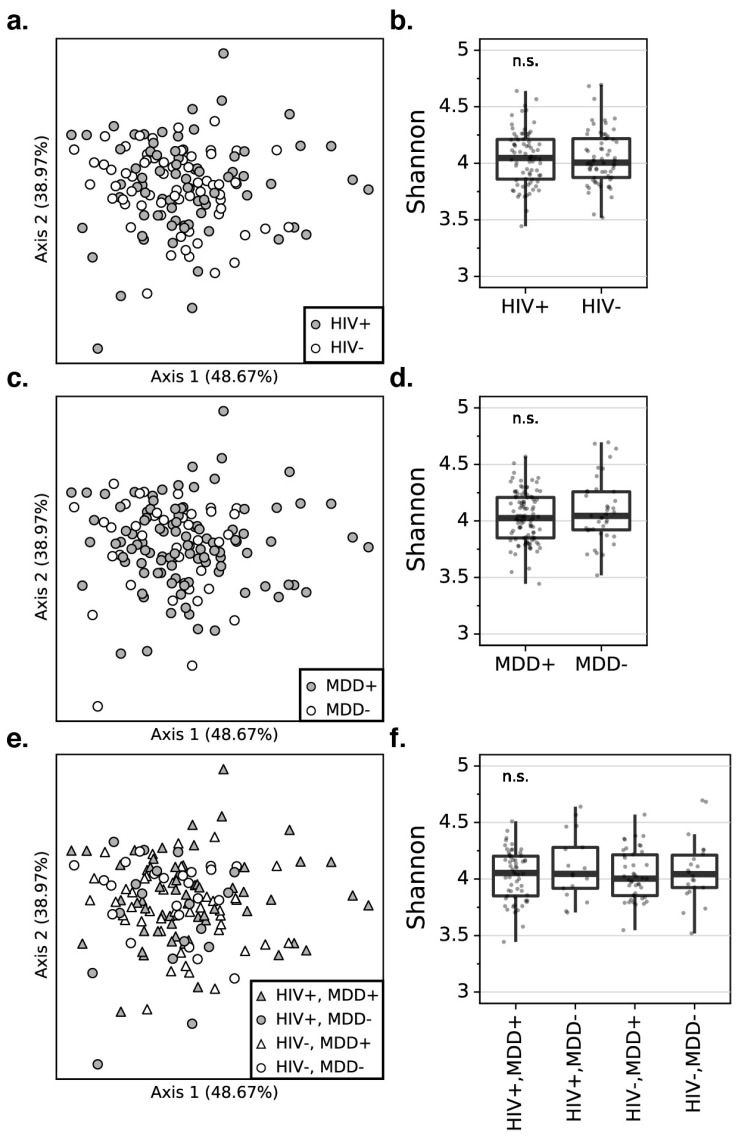
Figure 2.
The PCoA plots for the robust principal component analysis (RPCA) distance matrix reveal that there is no significant difference in the beta diversity between PWH and PWoH (a), participants with and without MDD (c), and combined HIV and MDD groups (e). The percentage of the total variance is presented by each axis. The box plots represent that there is no significant difference in the alpha diversity using the Shannon index between PWH and PWoH (b), participants with and without MDD (d), combined HIV and MDD groups (f). PWH: people with HIV, PWoH: people without HIV, MDD: major depressive disorder.

