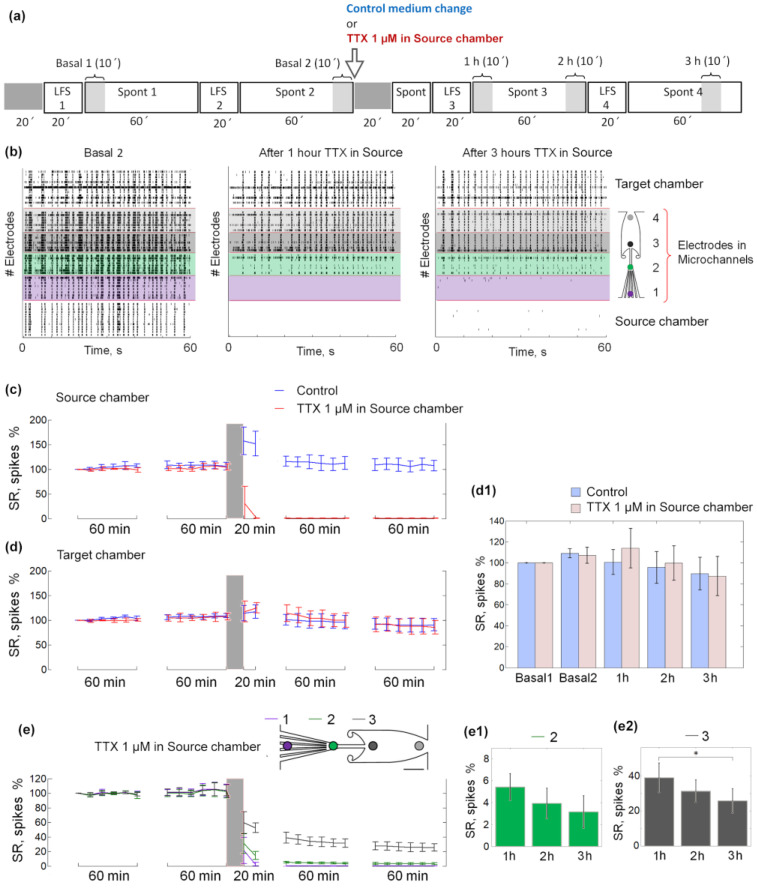
Figure 2.
Network activity with 1μM TTX application in the Source chamber. (a) The experimental protocol consisted of spontaneous activity recording (Spont) and low-frequency stimulation (LFS) series. The arrow indicates the application of TTX to the Source chamber or the change of medium in control experiments. (b) An example of raster plots showing 60 s of spontaneous activity in basal conditions (left), 1 h (middle), and 3 h (right) after TTX application in the Source chamber. Each dot represents a spike, each row an electrode. The electrodes are highlighted in color according to the scheme on the right. (c,d) Spiking rate (SR) of spontaneous network activity normalized to the SR in the first 10 min of the recording. Each dot represents SR (Mean ± s.d.) during 10 min for the neuronal network in the Source chamber (C) and the neuronal network in Target chamber (d). The red line corresponds to the activity of cultures with 1μM TTX in the Source chamber, blue line corresponds to the activity of control cultures. The gray-shaded area indicates a 15–20 min recording stop during and after manipulation with culture medium and TTX treatment. (d1) Diagram of SR at the first (Basal 1) and the last (Basal 2) 10 min time intervals of basal activity recording, and 1, 2, and 3 h after manipulation with culture medium and TTX application (1–3 h, respectively) in control experiments (blue), and with 1 μM TTX in the Source chamber (red). (e) SR of spontaneous network activity normalized to the SR in the first 10 min of the recording. Each dot represents SR during the 10 min for the neuronal network in electrodes nearest to the Source chamber (marked as 1, purple line), electrodes in the narrow section of microchannels (marked as 2, green line), and electrodes in the wide section of microchannels (marked as 3, gray line) of each culture with 1μM TTX in the Source chamber. (e1,e2) Diagram of SR at 10-min time intervals of spontaneous activity 1, 2, and 3 h after TTX application into the Source chamber (1–3 h, respectively), recorded by the electrodes in the narrow section of microchannels (e1) and 8 electrodes in the wide section of microchannels (e2). Data are represented as Mean ± s.d. Statistical analysis was carried out using ANOVA and a Wilcoxon rank-sum comparison test. Five experiments were in control and TTX groups, * p < 0.05.

