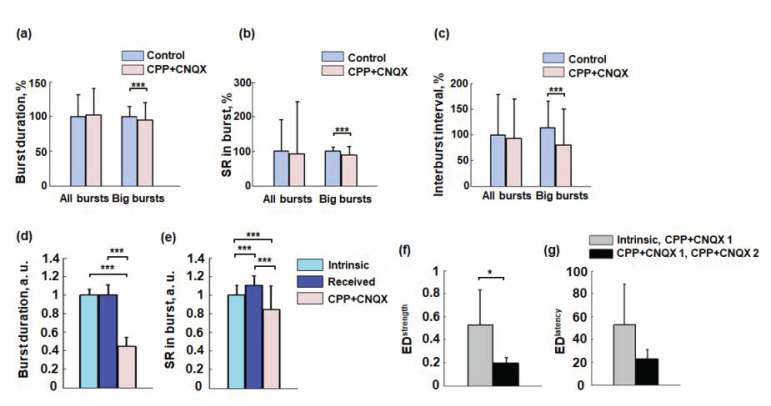
Figure 3.
Spontaneous activity before and after suppression of excitatory synaptic activity in the Source chamber. (a–c) All spontaneous bursts and big spontaneous bursts duration, spiking rate in burst, and interburst interval in the Target chamber (median ± m.a.d., n = 6 experiments, Mann–Whitney test, *** p < 0.001). (d,e) Duration and spiking rate of the Intrinsic, Received big bursts under Control condition and big bursts under CPP + CNQX condition (see Methods) (median ± m.a.d., n = 6 experiments, Mann–Whitney test with Bonferroni correction, *** p < 0.001). (f,g) Functional connectivity changes measured by Euclidean distance between connectivity strengths (EDstrength) and connectivity latencies (EDlatency) (see Section 2). Connectivity was compared for two sets of the big bursts (Intrinsic, CPP + CNQX 1) and (CPP + CNQX 1, CPP + CNQX 2) (median ± m.a.d., n = 6, Wilcoxon rank-sum test, * p < 0.05).

