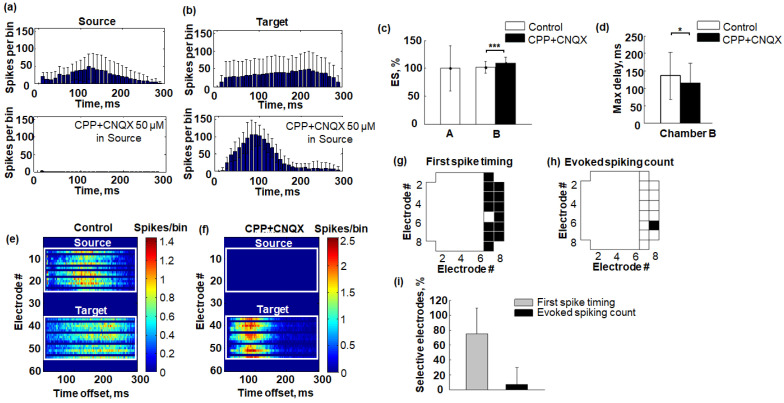
Figure 4.
Response to stimulation of axons in microchannels before and after blocking synaptic transmission in the Source chamber. (a) An example of network response post-stimulus time histogram (PSTH) in the Source chamber under basal and under CPP + CNQX conditions. (b) An example of network response PSTH in the Target chamber under basal conditions and after the application of the mixture of CPP + CNQX to the Source chamber. (c) The evoked spikes (ES) are normalized to the median value under basal conditions (median ± m.a.d., n = 6 experiments, Mann–Whitney test, *** p < 0.001). (d) The delay of the PSTH maximum (Max delay) in the Target chamber (median ± m.a.d., n = 6 experiments, Mann–Whitney test, * p < 0.05). (e,f) An example of the spiking profile of network response for each recording electrode in the Source and Target chambers under basal conditions (e) and after the application of the mixture of CPP + CNQX to the Source chamber (f). (g,h) An example of selective electrodes in the Target chamber comparing First spike timing (g) and Evoked spiking count (h) in network responses before and after application of CPP + CNQX to the Source chamber. (i) Number of selective electrodes in the Target chamber comparing First spike timing (c) and Evoked spiking count (median ± m.a.d., n = 6, Wilcoxon rank-sum test, p = 0.063).

