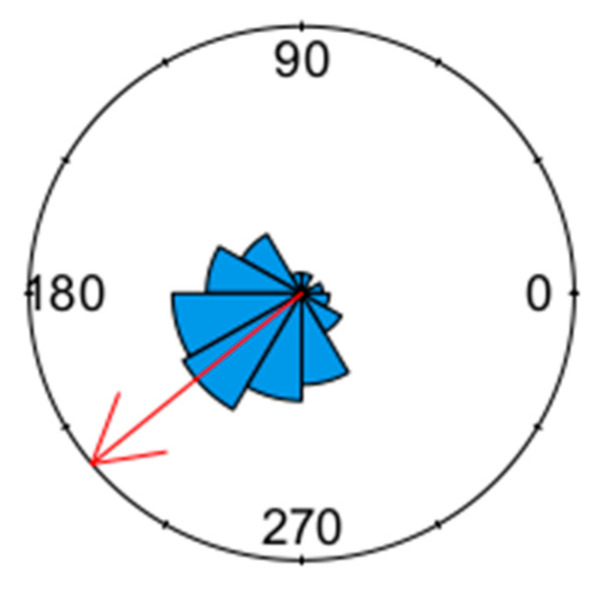
Figure 2.
Circular plot of the number of LCSB male moths collected in delta traps at Jay, Santa Rosa County, Florida. The Rose diagram indicates the relative frequency of the moths collected across the days of the year from 0° (January 1) to 360° (December 31). The red arrow indicates the mean direction of abundance (219.68°, month = August).

