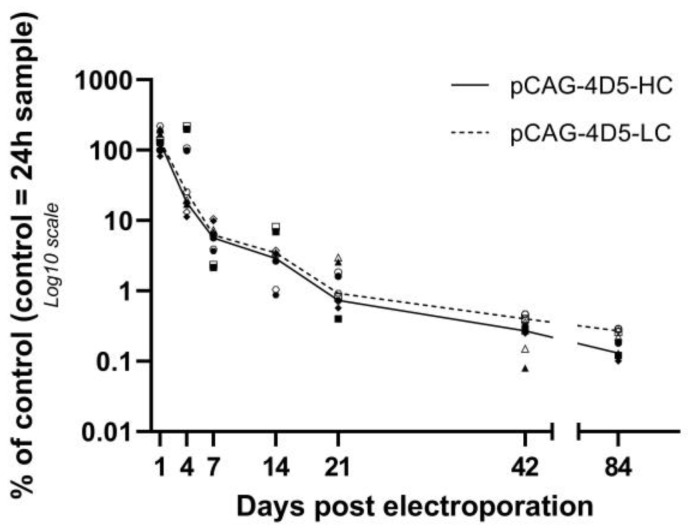
Figure 1.
pDNA quantification. Balb/c mice received intramuscular pDNA electrotransfer of 60 µg pDNA (equimolar mixture pCAG-4D5-HC and pCAG-4D5-LC) in the tibialis anterior muscle. Muscles were isolated at multiple time points post treatment, DNA extracted and quantified using qPCR. pDNA quantification (closed symbols: pCAG-4D5-HC, open symbols: pCAG-4D5-LC) is represented relative to the amount of the control subject at 24 h. Data are presented as individual data points per animal (mean of two independent runs, in which samples were run in duplicate). pCAG-4D5-HC and pCAG-4D5-LC of the same animal are indicated with the same symbol. Data from each time point originate from different animals. Curves represent the median per time point (line: pCAG-4D5-HC, dashed line: pCAG-4D5-LC) (n = 5, five mice per time point).

