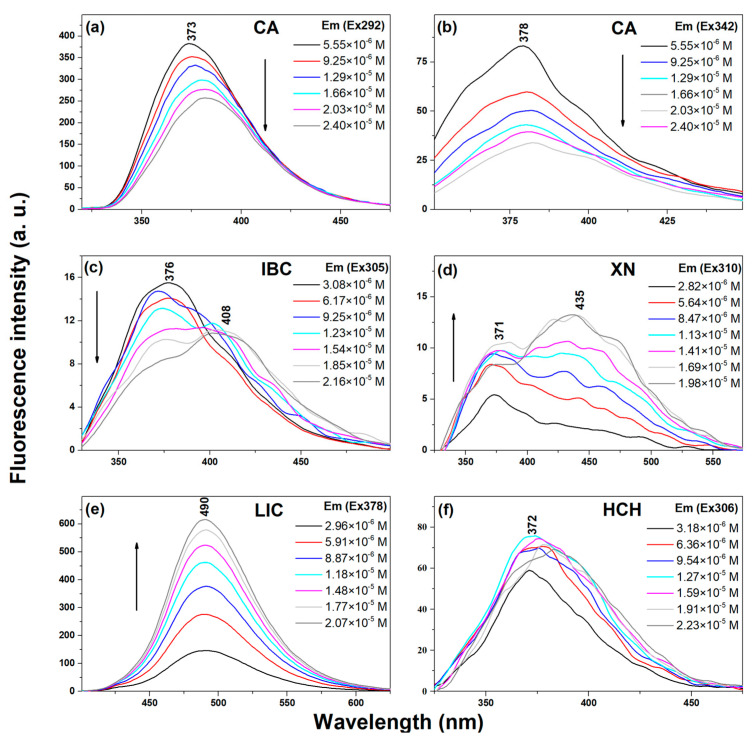
Figure 2.
Fluorescence emission spectra of chalcones CA, IBC, XN, LIC and HCH in the methanol solution at different concentrations. The excitation was set at the fluorescence emission maximum of each sample, as pointed out in the figure. (a) CA Em (Ex 292), (b) CA Em (Ex 342), (c) IBC Em (Ex 305), (d) XN Em (Ex 310), (e) LIC Em (Ex 378) and (f) HCH Em (Ex 306).

