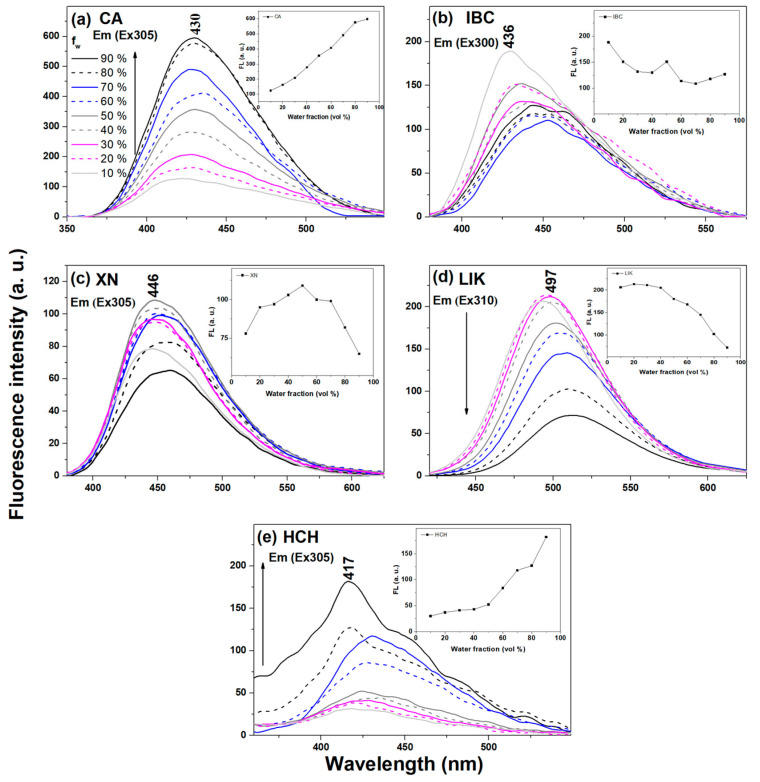
Figure 3.
Fluorescence emission spectra of chalcones in various MeOH:H2O proportions. The excitation was set at the fluorescence emission maximum of each sample, as pointed out in the figure. The insert shows the relationship between the maximum fluorescence intensity and the water fraction. (a) CA Em (Ex 305), (b) IBC Em (Ex 300), (c) XN Em (Ex 305), (d) LIK Em (Ex 310) and (e) HCH Em (Ex 305).

