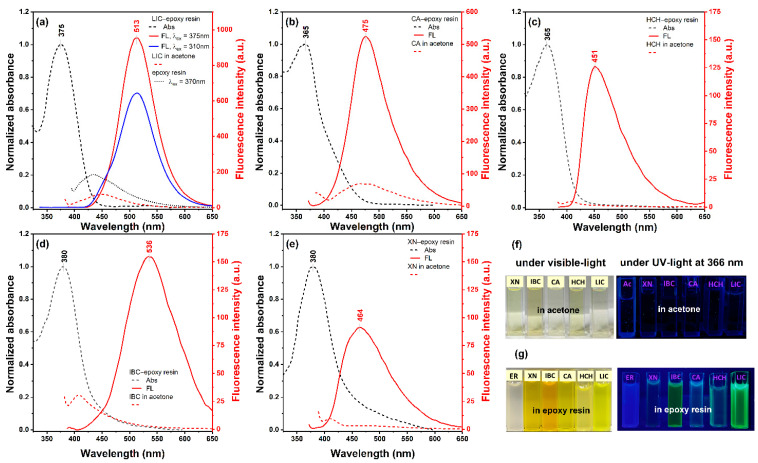
Figure 5.
Normalised absorption (dashed black lines) and fluorescence spectra of (a) LIC, (b) CA, (c) IBC, (d) XN and (e) HCH in the epoxy resin (solid red lines) and acetone (dashed red lines). Fluorescence spectra were recorded with the excitation wavelength at the absorption maximum of each compound in the solid state. (f) Photographs were taken in acetone (Ac) and (g) in the epoxy resin (ER) blended with chalcones in the acetone solution (20:1, v/v) in visible light and the illumination of UV light (366 nm).

