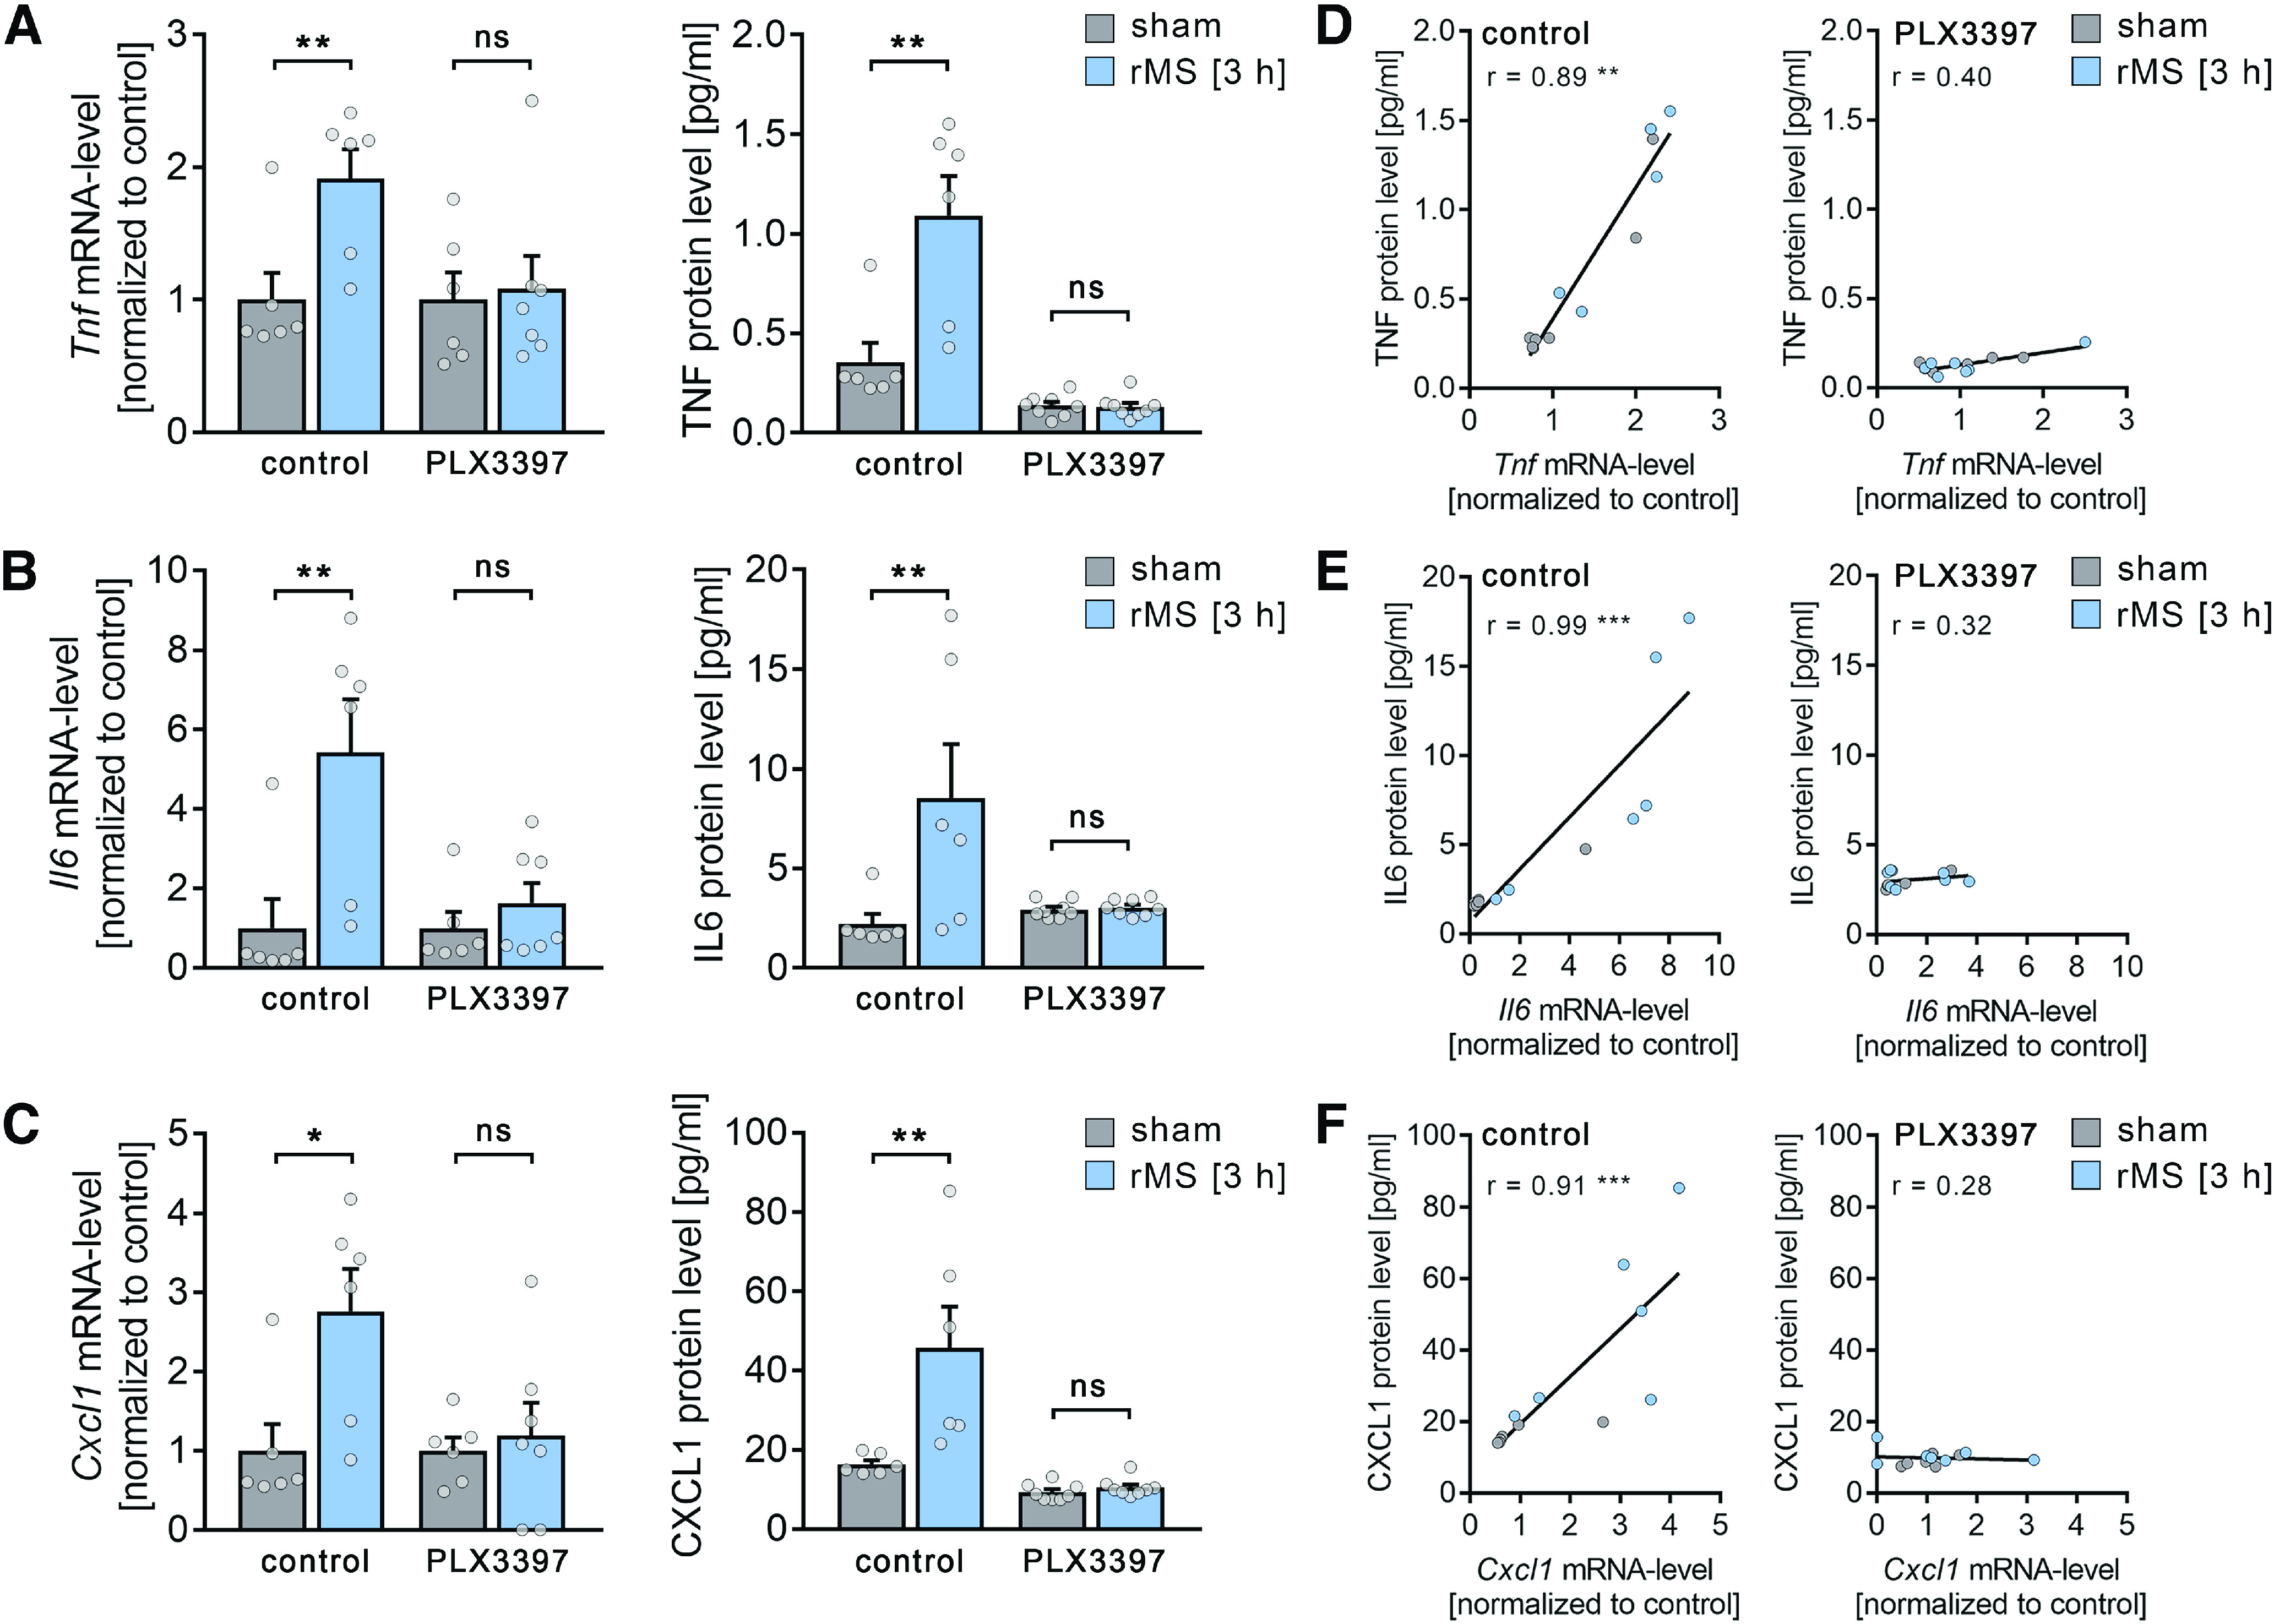
Figure 10.

rMS triggers the expression and release of plasticity-promoting microglial factors. A-C, Left panels, group data of mRNA levels of (A) TNFα, (B) IL6, and (C) CXCL1 in nondepleted cultures and microglia-depleted cultures (PLX3397-treated cultures) 3 h after 10 Hz rMS and sham stimulation (ncontrol mRNA = 6 cultures, respectively, for each experimental condition, nPLX3397 mRNA sham = 6 cultures, nPLX3397 mRNA rMS = 7 cultures; Mann–Whitney test, Ucontrol Tnf mRNA = 2, Ucontrol Il6 mRNA = 2, Ucontrol Cxcl1 mRNA = 3; for detailed statistical assessment, see Extended Data Table 10-1). Right panels, group data of protein levels of (A) TNFα, (B) IL6, and (C) CXCL1 in culturing medium of nondepleted cultures and microglia-depleted cultures (PLX3397-treated cultures) 3 h after 10 Hz rMS and sham stimulation (ncontrol protein = 6 culturing medium samples, respectively, for each experimental condition, n PLX3397 protein = 8 culturing medium samples, respectively, for each experimental condition; Mann–Whitney test, Ucontrol TNF protein = 2, Ucontrol IL6 protein = 2, Ucontrol CXCL1 protein = 0; for detailed statistical assessment, see Extended Data Table 10-1). D-F, Correlation of mRNA levels and protein levels of TNFα (D), IL6 (E), and CXCL1 (F) in nondepleted control cultures (left panels) and microglia-depleted (PLX3397-treated, right panels) cultures 3 h after 10 Hz rMS and sham stimulation (ncontrol = 6 cultures or culturing medium samples, respectively, for each experimental condition, nPLX3397-sham = 6 cultures or culturing medium samples, nPLX3397-rMS = 7 cultures or culturing medium samples; for detailed statistical assessment, see Extended Data Table 10-2). Gray dots represent individual data points. Data are mean ± SEM. *p < 0.05. **p < 0.01. ***p < 0.001.
