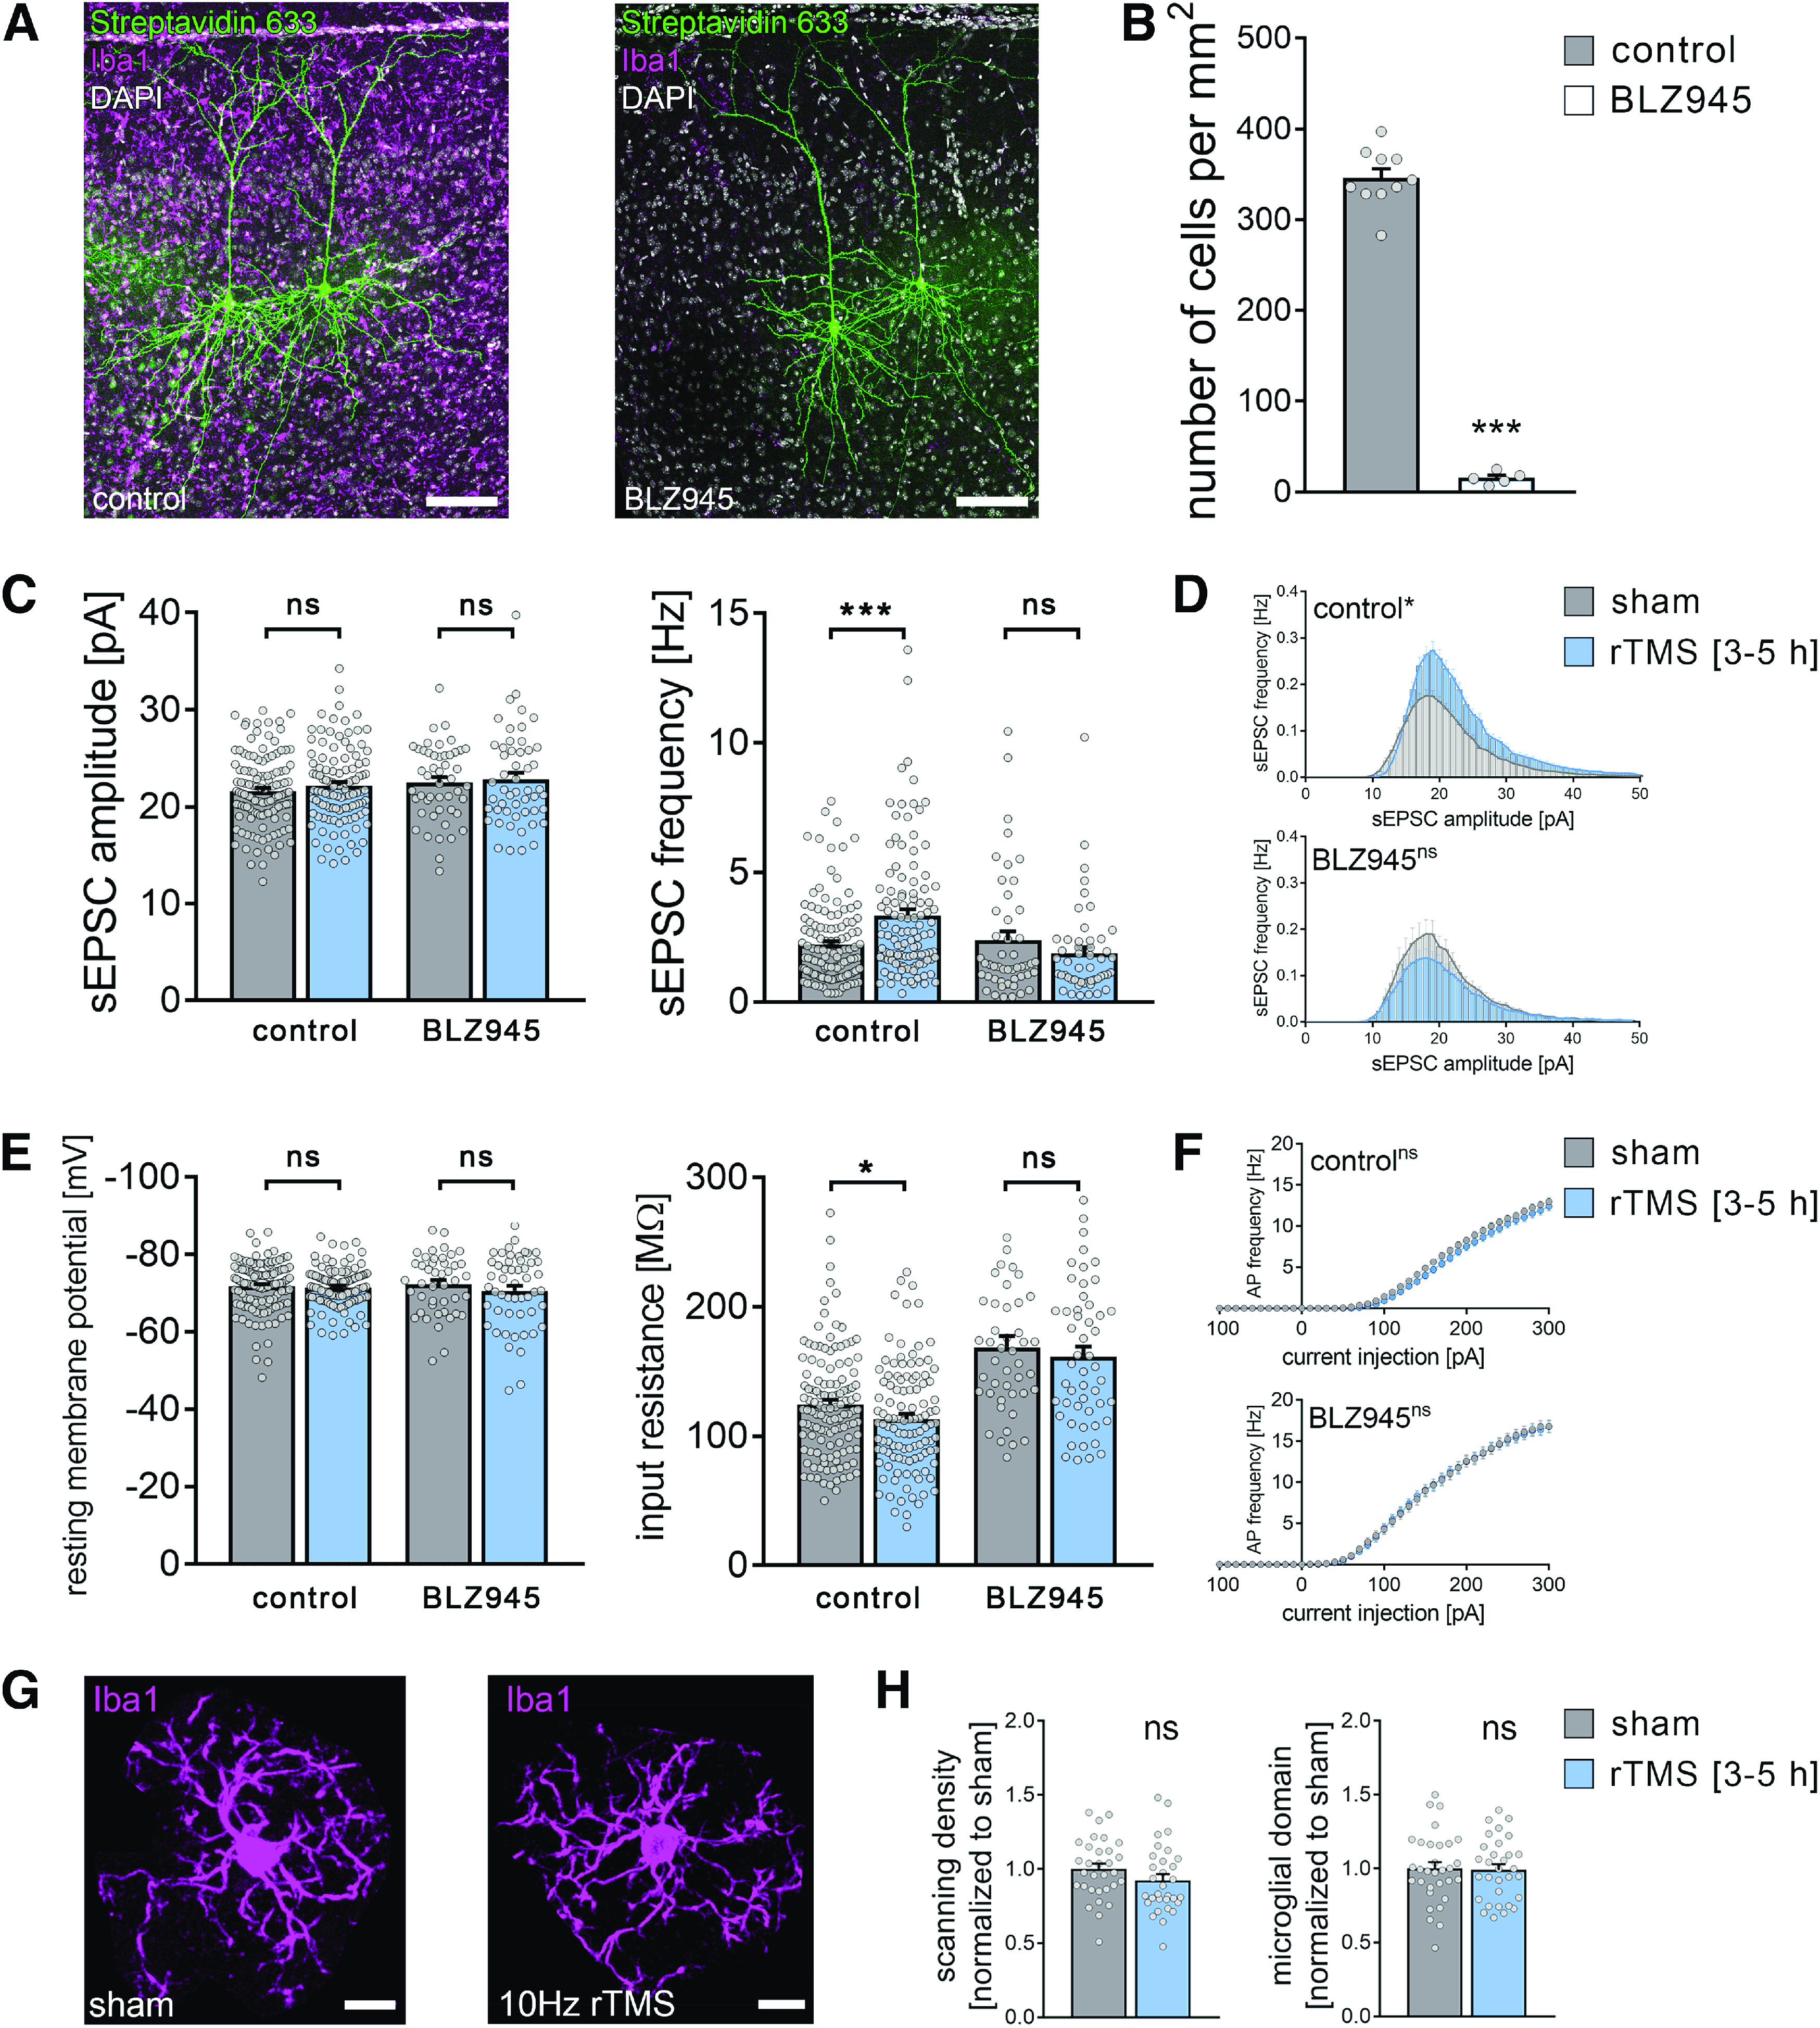
Figure 13.

Microglia depletion in vivo prevents rTMS-induced synaptic plasticity of superficial pyramidal neurons in the mPFC of adult mice. A, Post hoc visualization of superficial pyramidal neurons by streptavidin staining in the mPFC of nondepleted (left) and microglia-depleted (BLZ945-treated, right) adult mice. Microglia visualized by Iba1 immunolabeling. Scale bars, 100 µm. B, Quantification of microglia numbers confirmed an ∼90% reduction of microglia in the mPFC of BLZ945-treated animals (ncontrol = 10 animals, nmicroglia-depleted (BLZ945) = 5 animals; Mann–Whitney test, U = 0). C, Group data of AMPAR-mediated sEPSCs recorded from layer 2/3 pyramidal neurons in the mPFC of nondepleted and microglia-depleted mice 3-5 h after 10 Hz rTMS and sham stimulation (nondepleted animals: nsham = 124 cells from 8 animals, nrTMS = 111 cells from 8 animals; microglia-depleted [BLZ945-treated] animals: nsham = 48 cells from 2 animals, nrTMS = 51 cells from 3 animals; Mann–Whitney test, UsEPSC frequency, nondepleted = 2324). D, Amplitude-frequency plots of sEPSC recordings from the respective groups (repeated measures two-way ANOVA following Sidak's multiple comparisons test). E, F, Group data of passive and active membrane properties recorded from layer 2/3 pyramidal neurons in the mPFC of nondepleted and microglia-depleted mice 3-5 h after 10 Hz rTMS and sham stimulation (ncontrol-sham = 124 cells, ncontrol-rTMS = 111 cells, nBLZ-sham = 44 cells, nBLZ-rTMS = 51 cells; Mann–Whitney test and repeated measures two-way ANOVA followed by Sidak's multiple comparisons test for AP frequency analysis; Ucontrol-input resistance = 5836). One data point (input resistanceBLZ-sham = 413.8 mΩ) is outside the y axis limits. G, H, Representative images and group data of Iba1-stained microglia in the mPFC of nondepleted mice 3-5 h after 10 Hz rTMS and sham stimulation (nsham = 31 cells from 5 animals, nrTMS = 31 cells from 5 animals; Mann–Whitney test). Scale bars, 10 µm. Gray dots represent individual data points. Data are mean ± SEM. *p < 0.05. ***p < 0.001.
