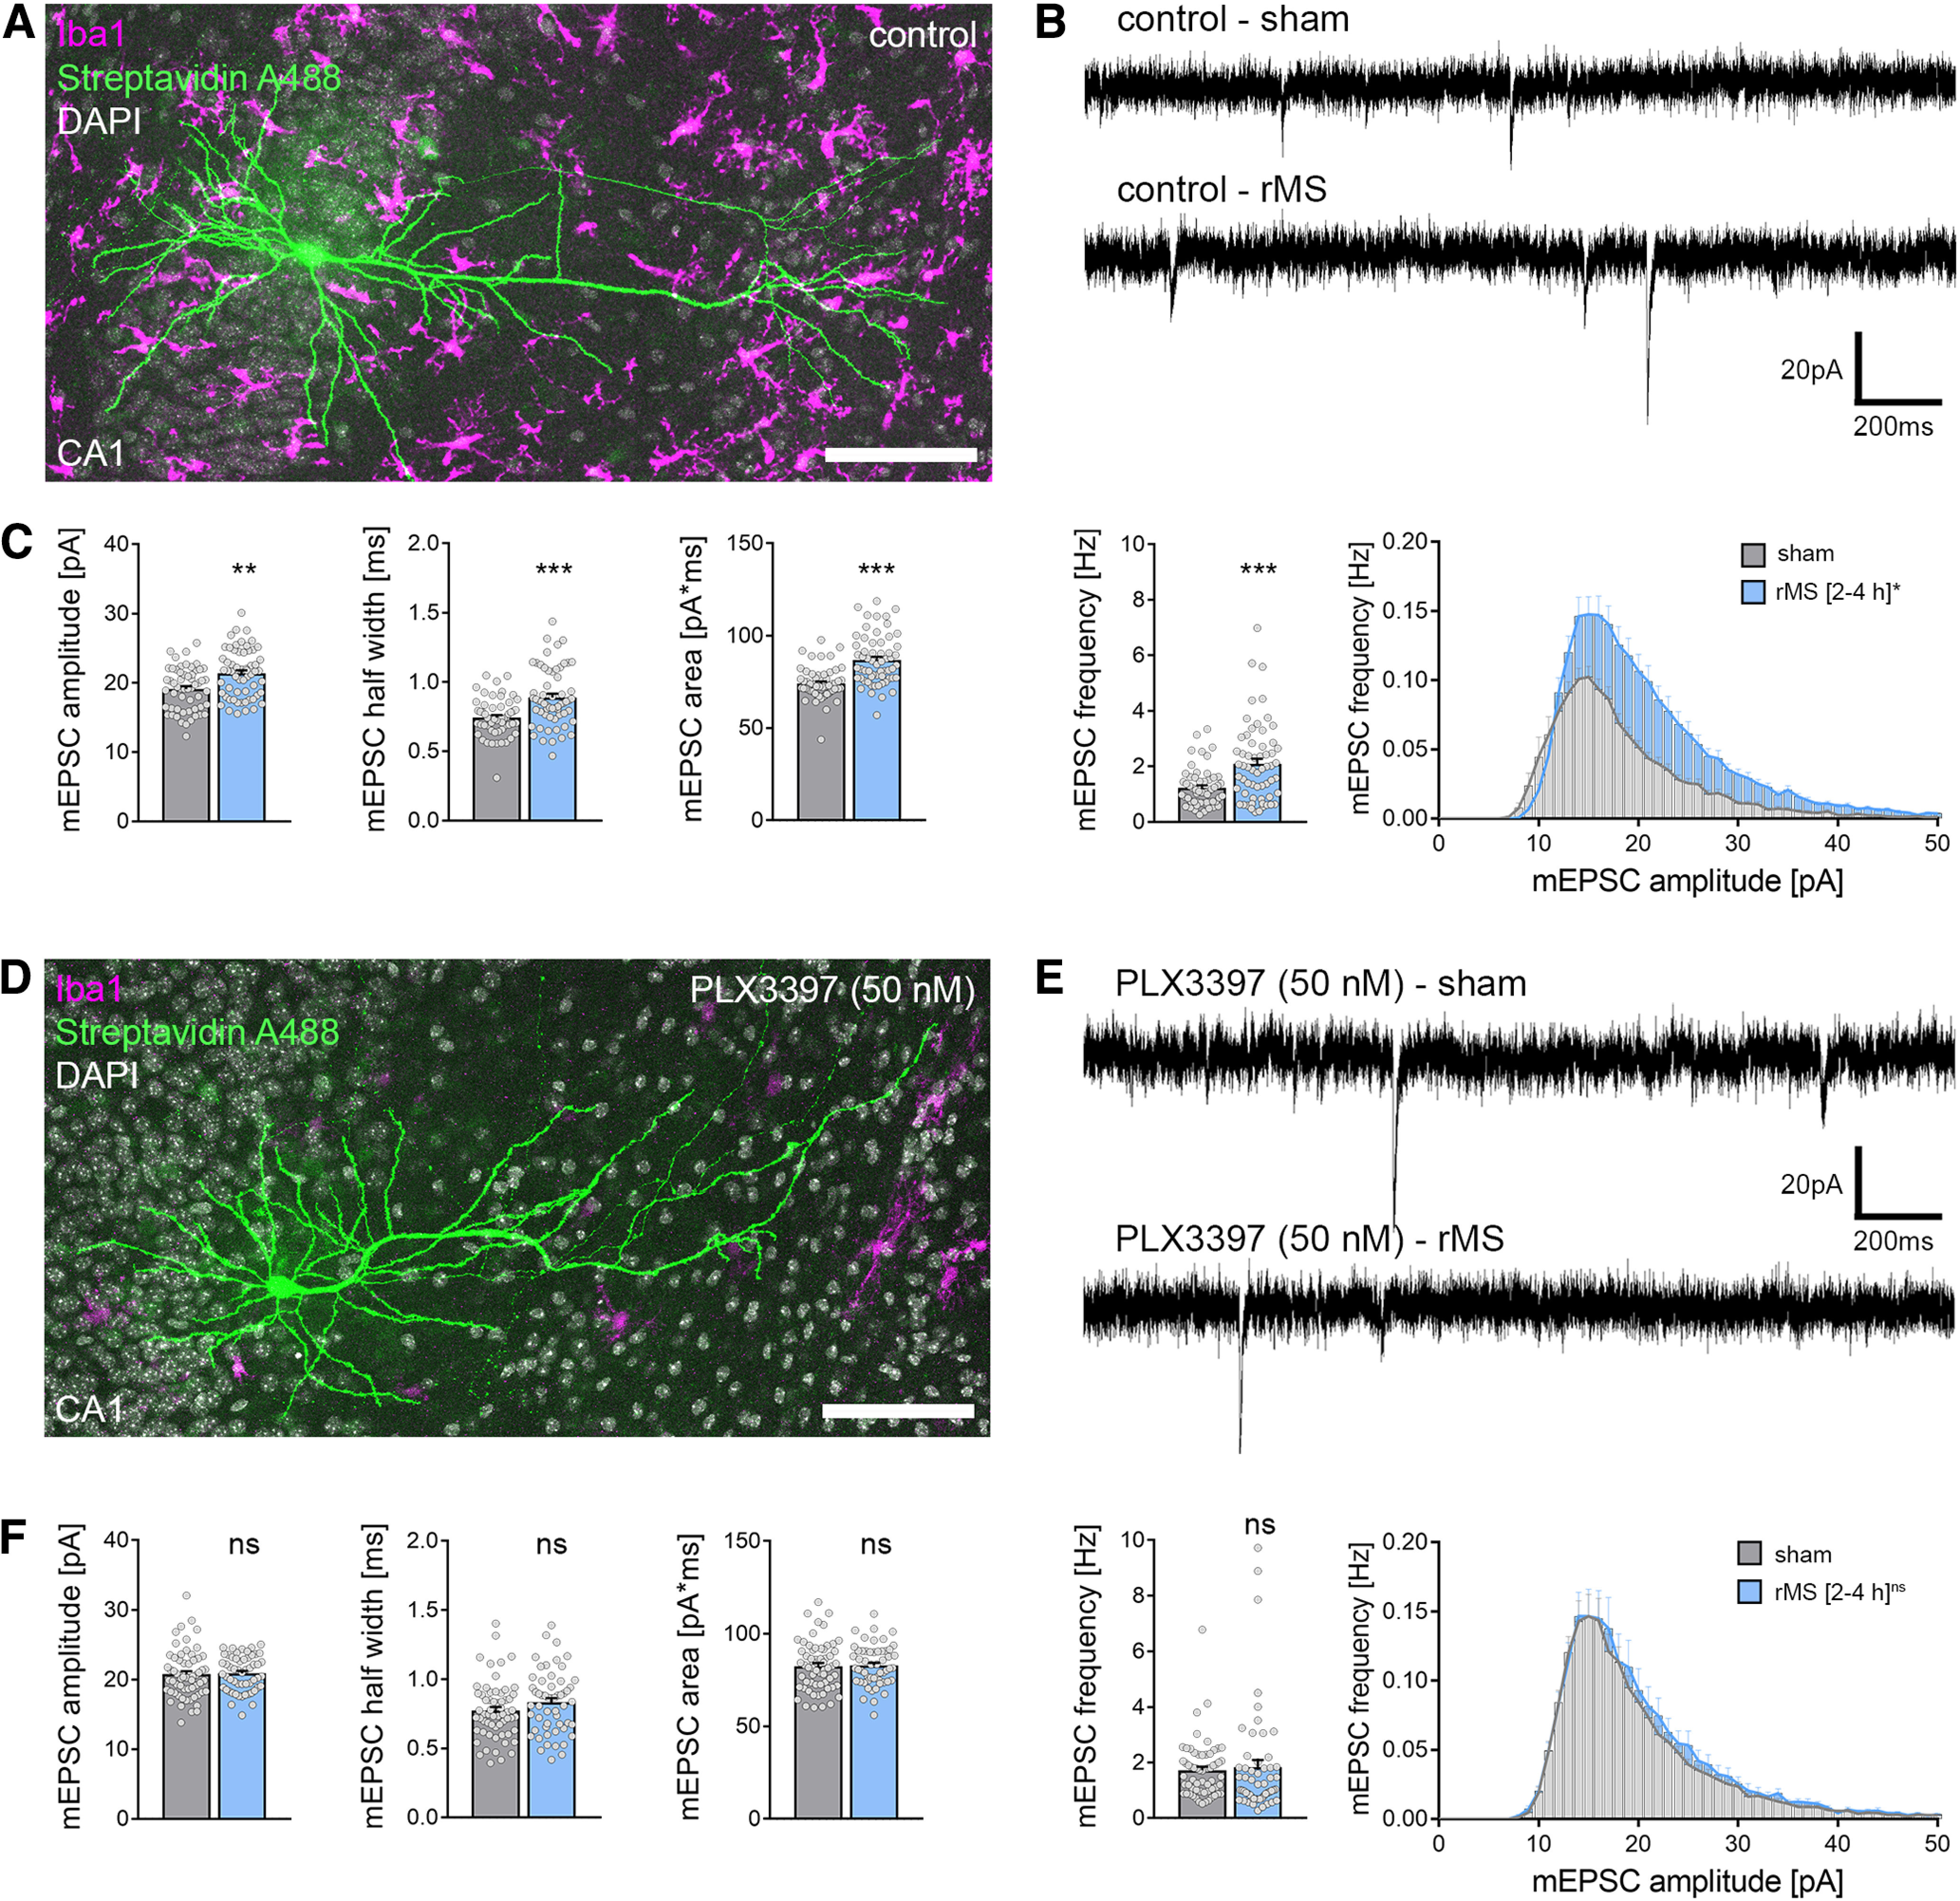
Figure 3.

CA1 pyramidal neurons in microglia-depleted tissue cultures do not express excitatory synaptic plasticity induced by 10 Hz rMS. A, Example of a recorded and post hoc stained CA1 pyramidal neuron in a tissue culture stained with the microglial marker Iba1. Scale bar, 100 µm. B, C, Sample traces and group data of AMPAR-mediated mEPSCs recorded from CA1 pyramidal neurons in sham-stimulated and 10 Hz rMS-stimulated cultures 2-4 h after stimulation (ncontrol-sham = 56 cells, ncontrol-rMS = 60 cells; Mann–Whitney test, Uamplitude = 1091, Uhalf-width = 1042, Uarea = 956, Ufrequency = 651; repeated-measures two-way ANOVA followed by Sidak's multiple comparisons test for amplitude-frequency-plot). D, Example of a recorded and post hoc stained CA1 pyramidal neuron in a PLX3397-treated, microglia-depleted tissue culture stained with the microglial marker Iba1. Scale bar, 100 µm. E, F, Representative traces and group data of AMPAR-mediated mEPSCs recorded from CA1 pyramidal cells in sham-stimulated and 10 Hz rMS-stimulated microglia-depleted tissue cultures 2-4 h after stimulation (nPLX3397-sham = 61 cells, nPLX3397-rMS = 55 cells; Mann–Whitney test; repeated measures two-way ANOVA followed by Sidak's multiple comparisons test for amplitude-frequency plot). Gray dots represent individual data points. Data are mean ± SEM. **p < 0.01. ***p < 0.001.
