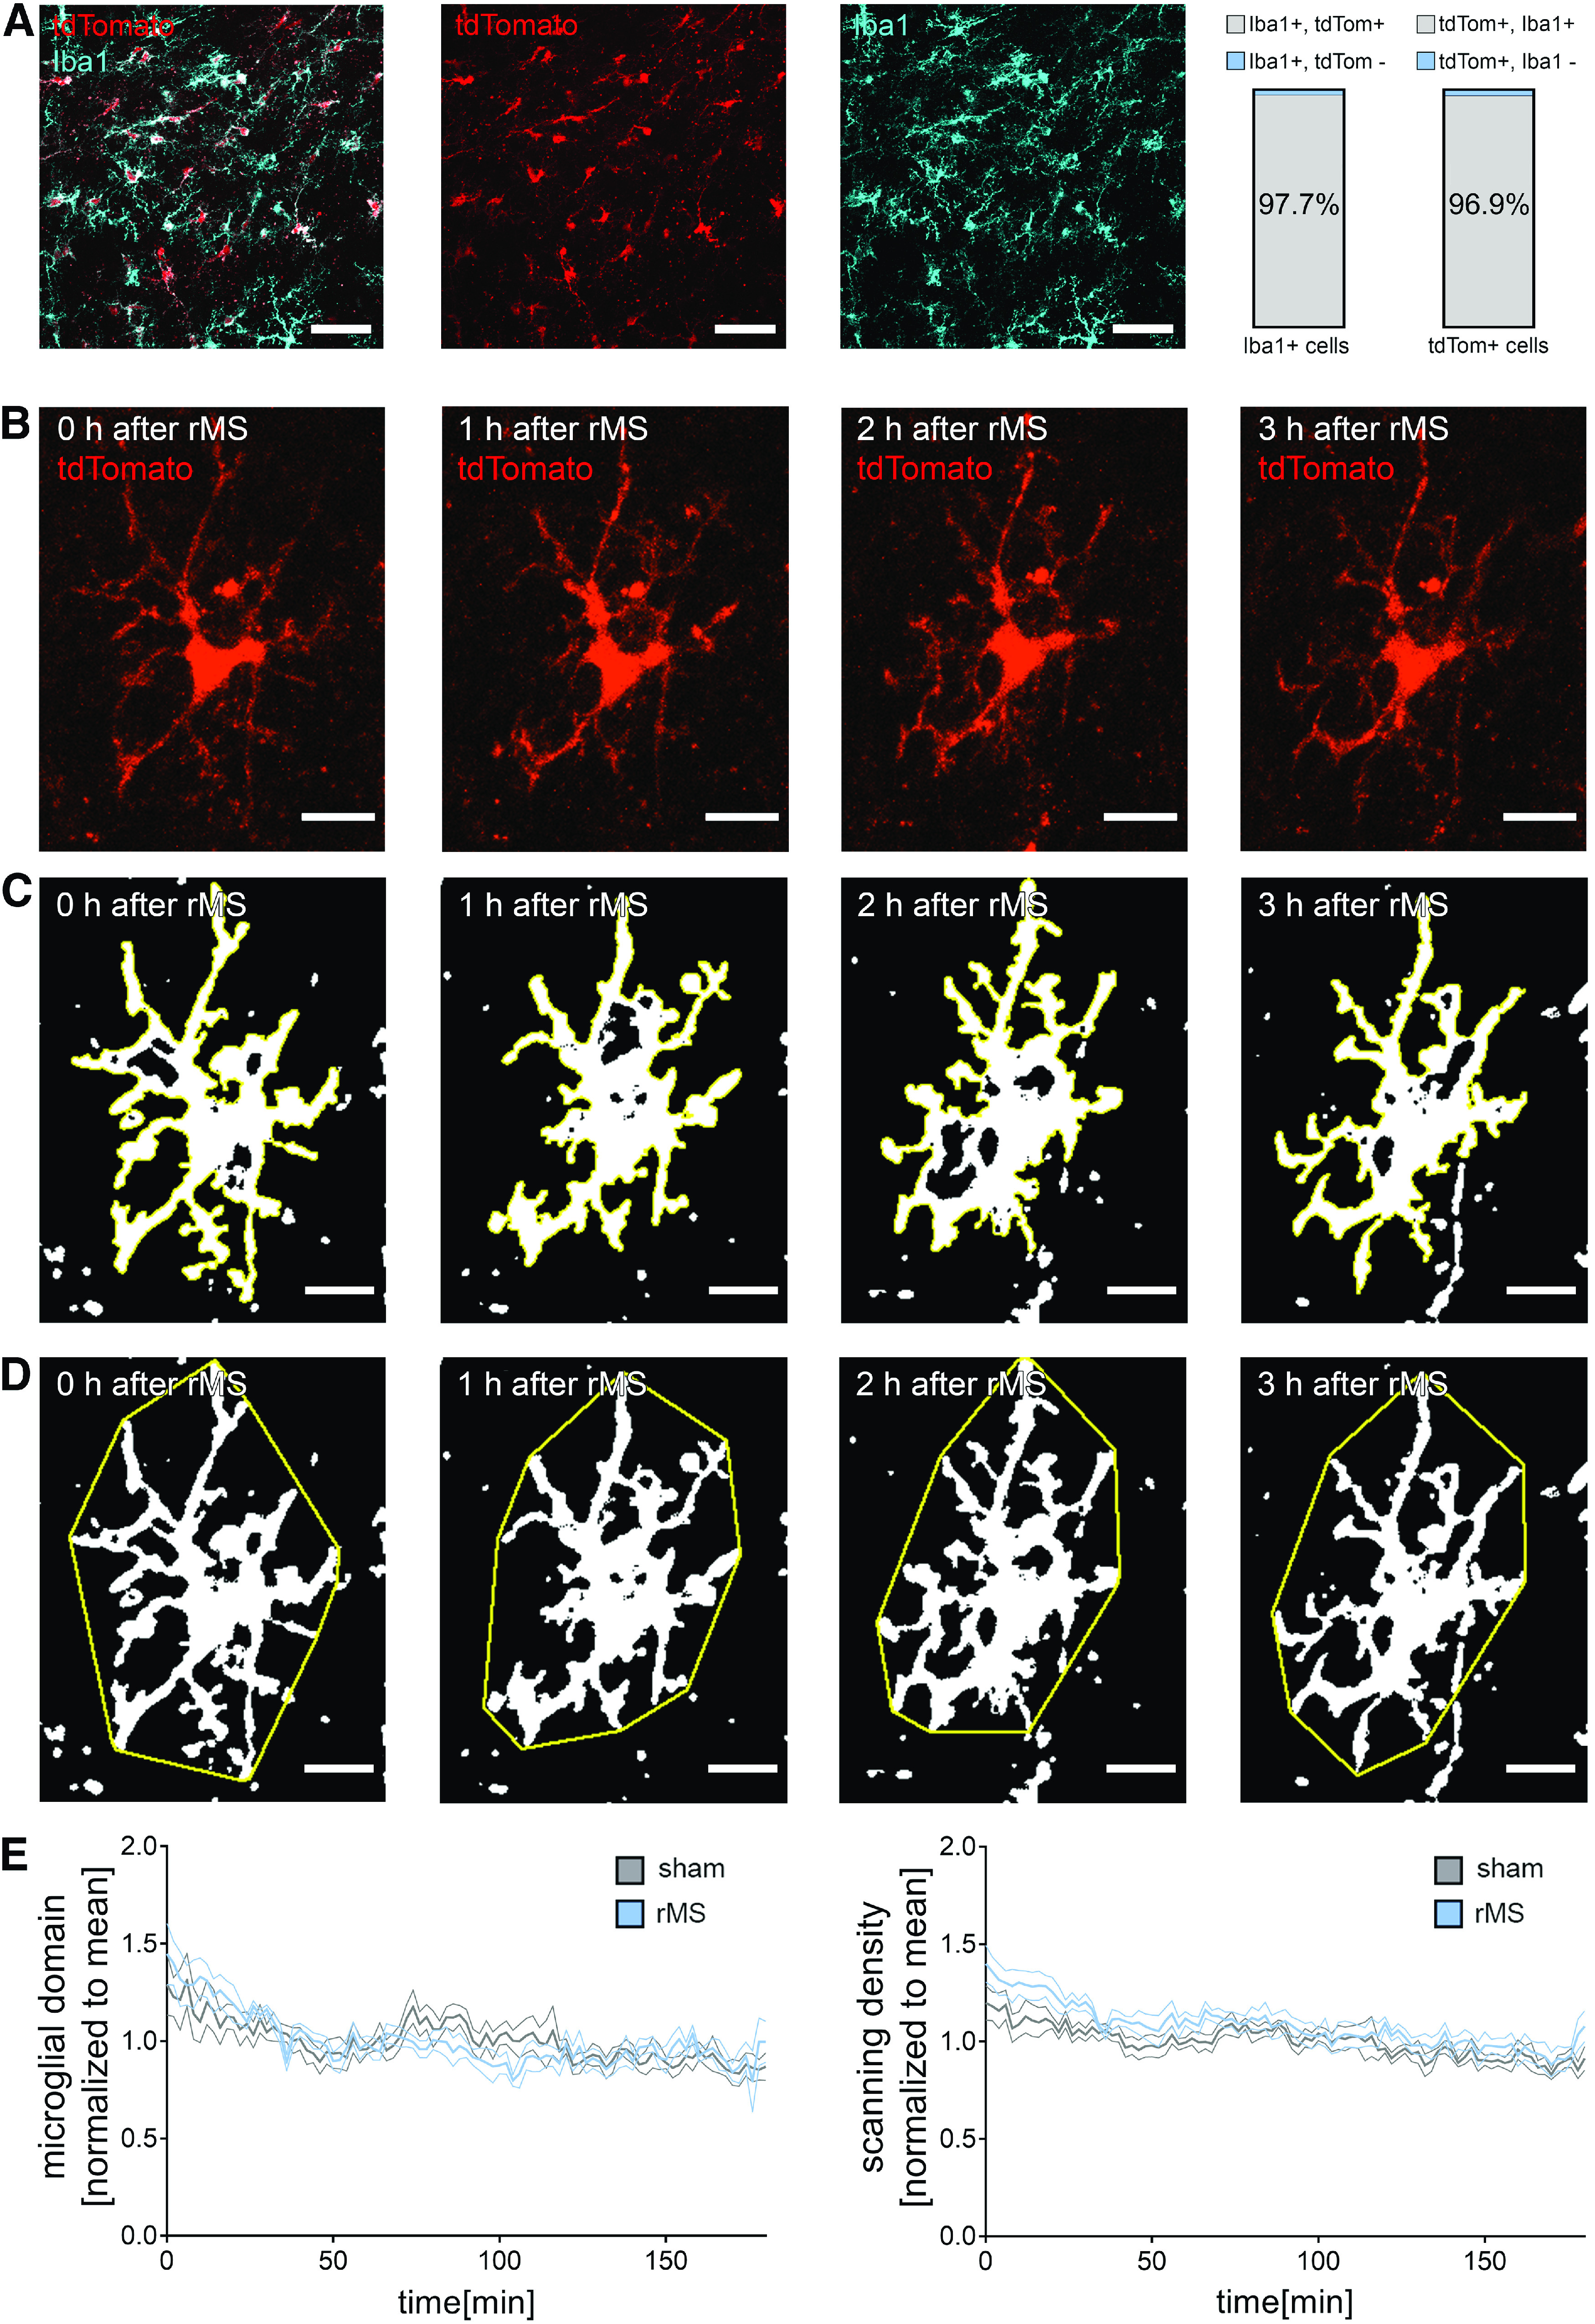
Figure 8.

rMS does not affect microglia morphology. A, Representative image of Iba1-stained tissue culture prepared from homozygous HexBtdT/tdT mice. Note tandem dimer (td) Tomato-expressing microglia. Right, Group data showing an almost complete overlap of the two signals (nIba1+ = 273 cells in 5 cultures; ntdTomato+ = 274 cells in 5 cultures.). Scale bars, 50 µm. B-D, Examples of tdTomato-expressing microglia in hippocampal area CA1 imaged from HexBtdT/tdT cultures over a period of 3 h following 10 Hz rMS (2 min intervals). Maximum intensity projections of image stacks (B), microglial scanning densities (C), and microglial domains (D) are illustrated. Scale bars, 15 µm. E, Group data of microglial domains and scanning densities from rMS-stimulated and sham-stimulated tissue cultures (nsham = 6 cells, nrMS = 6 cells from 6 cultures in each group; repeated measures two-way ANOVA followed by Sidak's multiple comparisons). Data are mean ± SEM.
