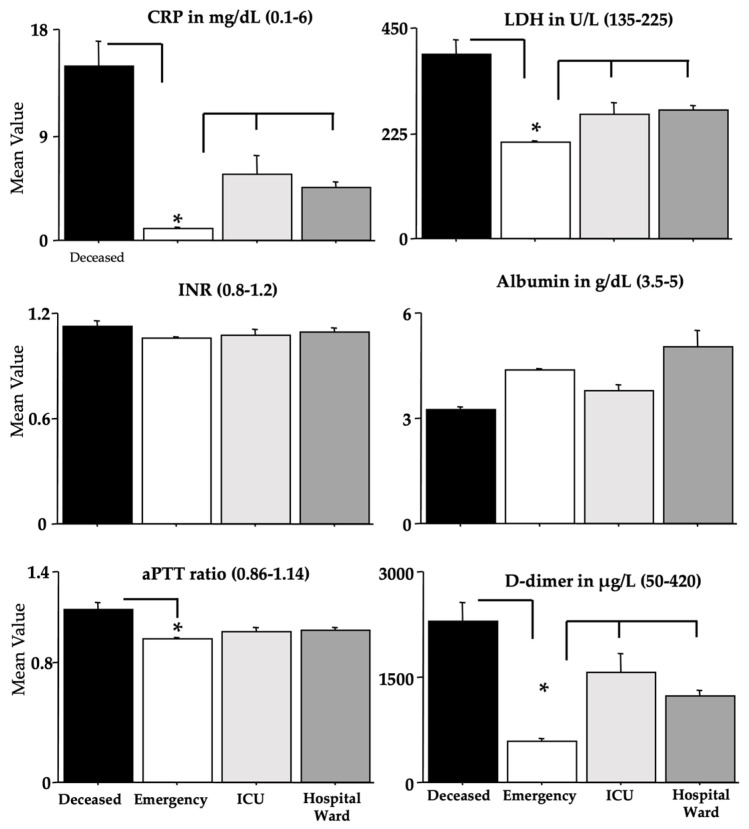
Figure 5.
CRP, LDH, INR, albumin, aPTT, and D-dimer in recruited individuals (and relative reference ranges). The error bars indicate the pooled standard error means (SEM) derived from the appropriate error mean square in the ANOVA. The asterisks (* p < 0.05) indicate post hoc differences between groups.

