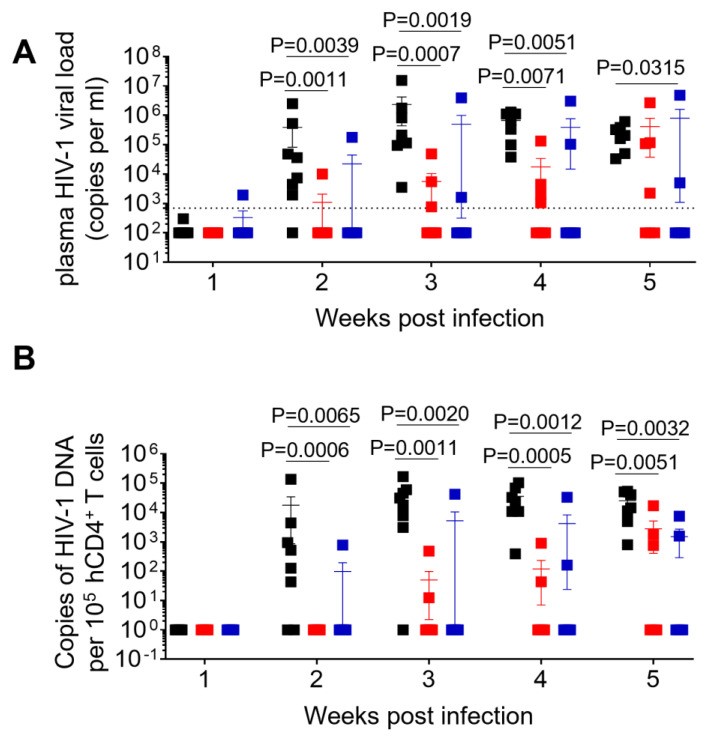
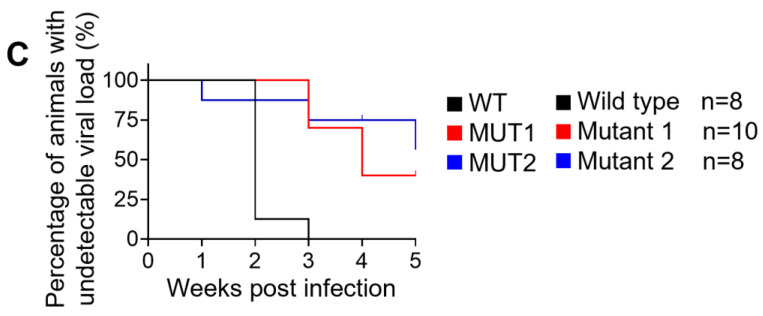
Figure 2.
Longitudinal analysis of plasma viral load and cell-associated HIV-1 DNA. (A) Plasma HIV-1 viral load was monitored longitudinally by real-time PCR. (B) Levels of cell-associated HIV-1 DNA were monitored longitudinally by real-time PCR. (C) Kaplan–Meier curve depicts the percent of animals with undetectable plasma viral load following exposure. Data in (A,B) are expressed as mean± SEM. Statistical significance was determined using a two-sided Kruskal–Wallis test in (A,B), and a Mantel–Cox test in (C). p values between WT and MUT1, WT and MUT2 in (C) are <0.0001 and 0.0033, respectively.


