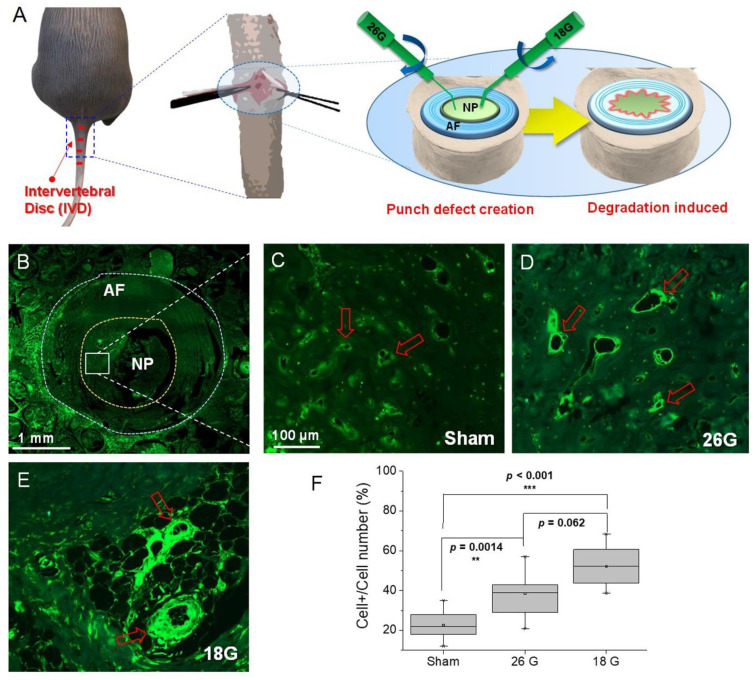
Figure 4.
(A) Schematic diagram showing the induction of a rat intervertebral disc (IVD) injury model. (B–E) Immunofluorescence images of rat intervertebral disc with COX-2 primary antibody. (B) Low-magnification image showing COX-2 distribution in a normal intervertebral disc. (C–E) High-magnification images showing COX-2 distribution in (C) normal and (D) 26G- and (E) 18G-needle-puncture-injured intervertebral discs. Red arrows point to representative cells showing differences before and after overexpression. (F) Box plot of fluorescence intensity in (B–E). The fluorescence images and intensities were acquired by using a slide scanner (Zeiss Axio Scan. Z1, ®Carl Zeiss) and measured in 100 randomly chosen regions. Asterisks indicate statistical significance (** p < 0.01, *** p < 0.001). The image above is a representative image from 7 repeated experiments. Scale bars: (B) 1 mm and (C–E) 100 μm.

