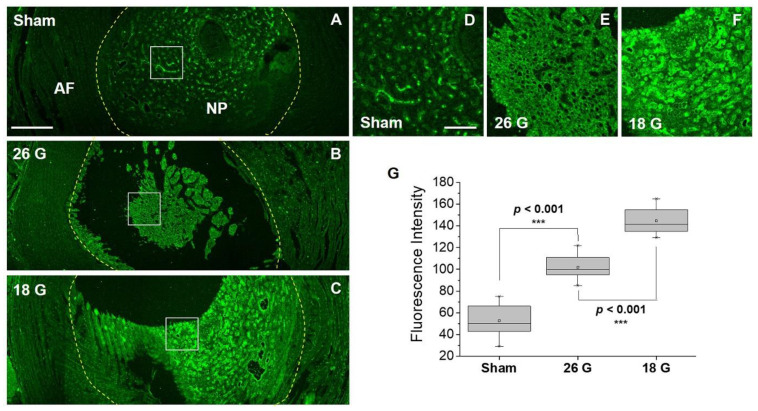
Figure 5.
Fluorescence confocal microscopy images showing NP (nucleus pulposus) and AF (annulus fibrosus) of rat intervertebral discs by 10 µM IBPC1. (A–C) Fluorescence images according to COX-2 distribution in intervertebral disc tissue under (A) sham, (B) 26G-, and (C) 18G-needle-puncture-damaged conditions, respectively. (D–F) Magnified images of the areas indicated by the white squares in A–C. (G) Box plot was obtained based on the fluorescence values of the NP region shown in images (D–F). The fluorescence images were obtained at 400–600 nm upon excitation at 405 nm and acquired at 100 randomly chosen regions. Asterisks indicate statistical significance (*** p < 0.001). Disc tissues shown are representative images from replicate experiments (n = 7). Scale bars: (A–C) 500 and (D–F) 100 μm.

