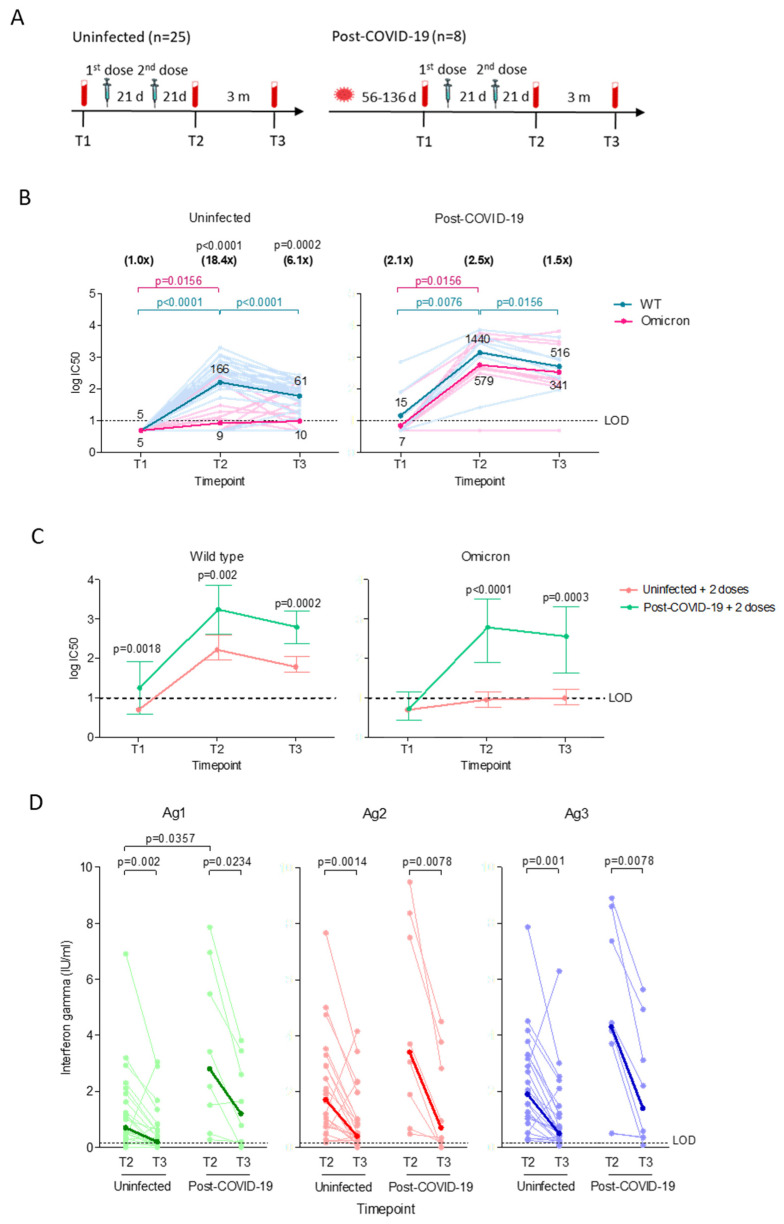
Figure 1.
Neutralizing antibody and T cell immune responses after two doses of vaccines in uninfected (n = 25) and post-COVID-19 individuals (n = 8). (A) Longitudinal study design. Plasma samples were collected before the first vaccine dose (T1), and 21 days (T2) and 3 months (T3) after the second dose. (B) Neutralizing antibody titers (log IC50) against pseudoviruses bearing wild type (WT) or Omicron spike proteins. Significant differences within groups were assessed with the two-tailed Wilcoxon matched-pair signed rank test. The horizontal lines represent neutralizing antibody titers of individual samples against WT (light blue) and Omicron (light pink). The dark blue (WT) and dark pink (Omicron) lines represent the geometric means of log transformed values. P values in blue and pink represent significant differences in neutralizing antibody titers against WT and Omicron, respectively. The numbers in parentheses represent the GMT fold changes in neutralization against Omicron compared with WT and significant p values are stated above the fold change numbers. (C) Comparison of the GMT ± 95% confidence intervals against WT or Omicron. Significant differences between groups were assessed using the Mann–Whitney U-test. Significant p values for each comparison are shown. All experiments were performed in duplicate. (D) T cell immune responses against QuantiFeron SARS-CoV-2 Ag1, Ag2 and Ag3. Interferon-ɣ levels were normalized against the nil tube value (background). The Wilcoxon matched-pairs signed rank test was used to determine the significant differences within groups. Comparison between the uninfected and post-COVID-19 group at the same time-points were assessed using the Mann–Whitney U-test. Responses are shown as dot plots with connecting horizontal lines to represent interferon-ɣ changes in individual samples. The bold lines represent the medians of interferon-ɣ responses.

