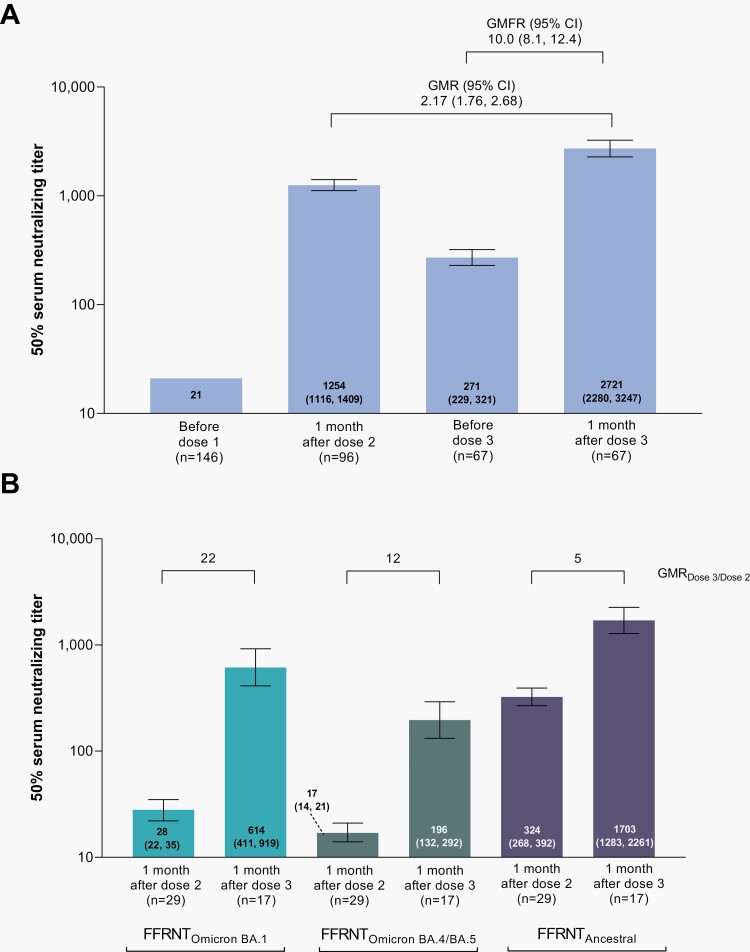
Figure 1.
Serum SARS-CoV-2 neutralization titers 1 month after BNT162b2 doses 2 and 3 in participants without evidence of prior SARS-CoV-2 infection. In Panel A, 50% neutralizing titers were determined in a validated microneutralization assay against ancestral SARS-CoV-2 strain (USA-WA1/2020). Results are in the dose 2 and dose 3 evaluable immunogenicity populations (defined in Supplementary Figure 1). The n value for the before dose 1 timepoint is the total number of participants who were either dose 2 evaluable or dose 3 evaluable. Values within the bars are GMTs (95% CIs). The geometric mean ratio (GMR) shown is 1 month after dose 3 to 1 month after dose 2 and the geometric mean fold rise (GMFR) shown is from before dose 3 to 1 month after dose 3. Assay results below the lower limit of quantitation (LLOQ) of 41 were set to 0.5 × LLOQ. In Panel B, 50% serum neutralizing titers against ancestral SARS-CoV-2 and the Omicron BA.1 and BA.4/BA.5 sublineages are shown. Values within the bars are GMTs (95% CIs) and the GMR after dose 3 to after dose 2 are shown above the bars. Assay results below the LLOQ of 20 were set to 0.5 × LLOQ. Results are in the Omicron neutralization subset (defined in Supplementary Figure 1A) and based on the Fluorescent Focus Reduction Neutralization Test (FFRNT). Results in participants with and without prior SARS-CoV-2 infection are in Supplementary Figure 2.

