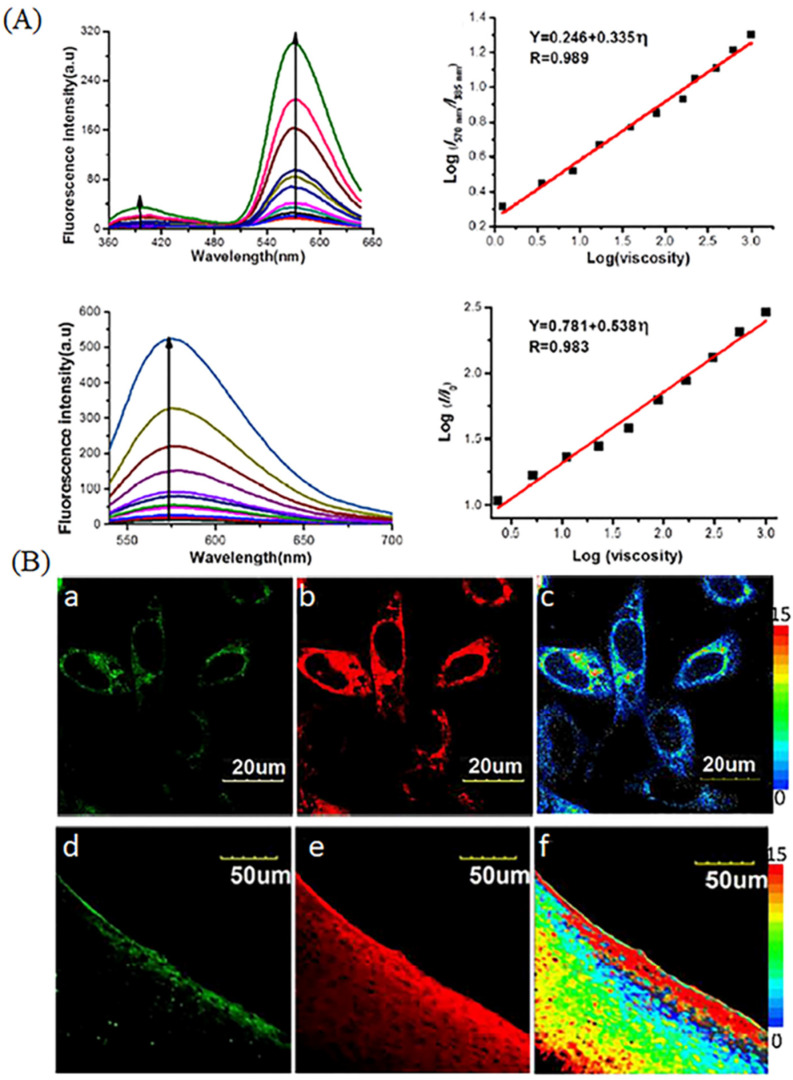
Figure 5.
(A) Fluorescence changes and the linear response in the spectra of Qca-Cy2 in the solvent viscosity. (B) Fluorescence images of Qca-Cy2 in living HeLa cells and rat hepar slice in two channels. (a,d): green channel picture; (b,e): red channel pictures; (c,f): ratio pictures of (a) and (b); (a–c): confocal pictures of HeLa cells; (d–f): confocal pictures of rat hepar slice. Reproduced from Ref. [46] with permission of the Elsevier, copyright 2018.

