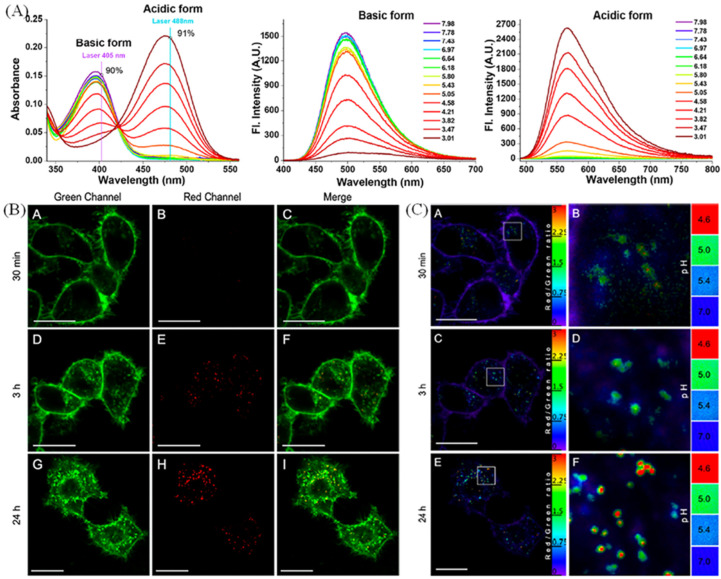
Figure 16.
(A) Absorbance and fluorescence spectra of probe in solutions with diverse pH values. (B) Confocal images of KB cells incubated with Mem-pH (1μM, 1 h), and imaged after diverse time (30 min, A, B, C; 3 h, D, E, F; and 24 h, G, H, I;) in two channels and the ratiometric images (C) of KB cells after the same treatments (A 30 min; C 3 h; E 24 h; B, D, F are the enlarged picture of A, C, E). Reproduced from [89] with permission of the American Chemical Society, copyright 2022.

