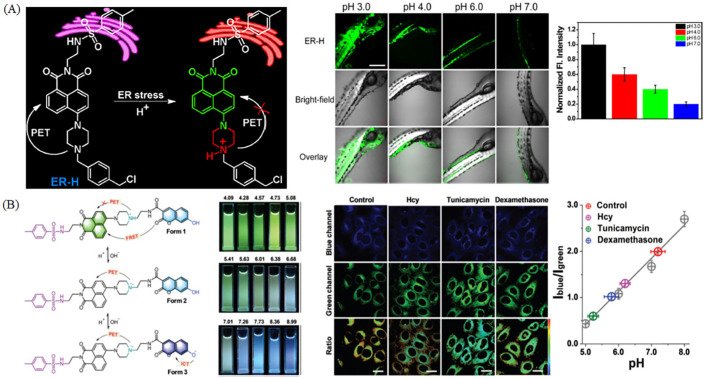
Figure 17.
(A) Response mechanism of ER-H to pH, and the relative two-photon fluorescence imaging of zebrafish in diverse pH. The column diagram is the relative intensity changes. Reproduced from 95 with permission of the Elsevier, copyright 2018. (B) The pH-response mechanism and photographs of CNER-pH under irradiation at 365 nm; fluorescence images of HeLa cells stained with CNER-pH stimulated with Hcy, tunicamycin or dexamethanose, and the corresponding quantitative data. Reproduced from [94] with permission of the Royal Society of Chemistry, copyright 2019.

