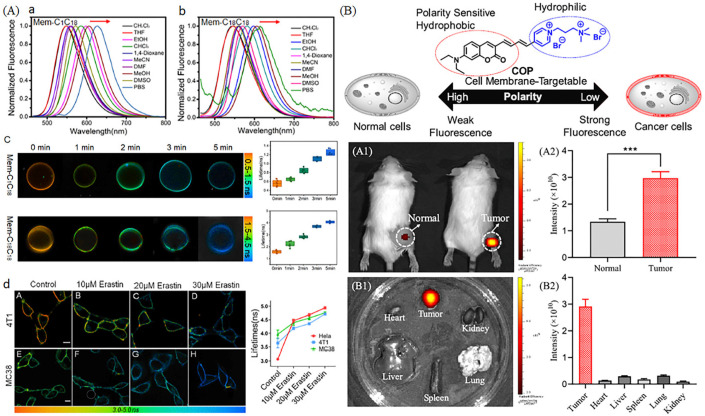
Figure 21.
(A) Fluorescence spectra of Mem-C1C18 (a) and Mem-C18C18 (b) in several different polarity solvents, and the GUVs pictures (c) with a certain period of lipid peroxidation. (d) Pictures of 4T1 and MC38 cells incubated with Erastin. Reproduced from 106 with permission of the American Chemical Society, copyright 2022. (B) Mechanisms of probe COP and their applications. (A1) Fluorescence pictures of normal and tumor rats stained with COP and the corresponding fluorescence intensity (A2). (B1) Fluorescence organ pictures of tumor rats stained with COP and the corresponding fluores-cence intensity (B2). *** p (statistical significance) = 0.0004. Reproduced from [105] with permission of the American Chemical Society, copyright 2022.

