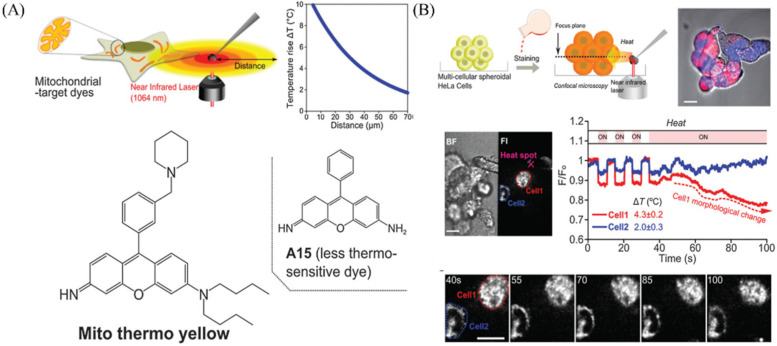
Figure 23.
(A) The imaging systems to visualize temperature sensitivity and structure of probe Mito thermos yellow. (B) Monitoring the temperature with probe Mito hermos yellow, and the images and time course of fluorescence intensity in multi-cellular spheroidal HeLa cells. Reproduced from [114] with permission of the Royal Society of Chemistry, copyright 2015.

