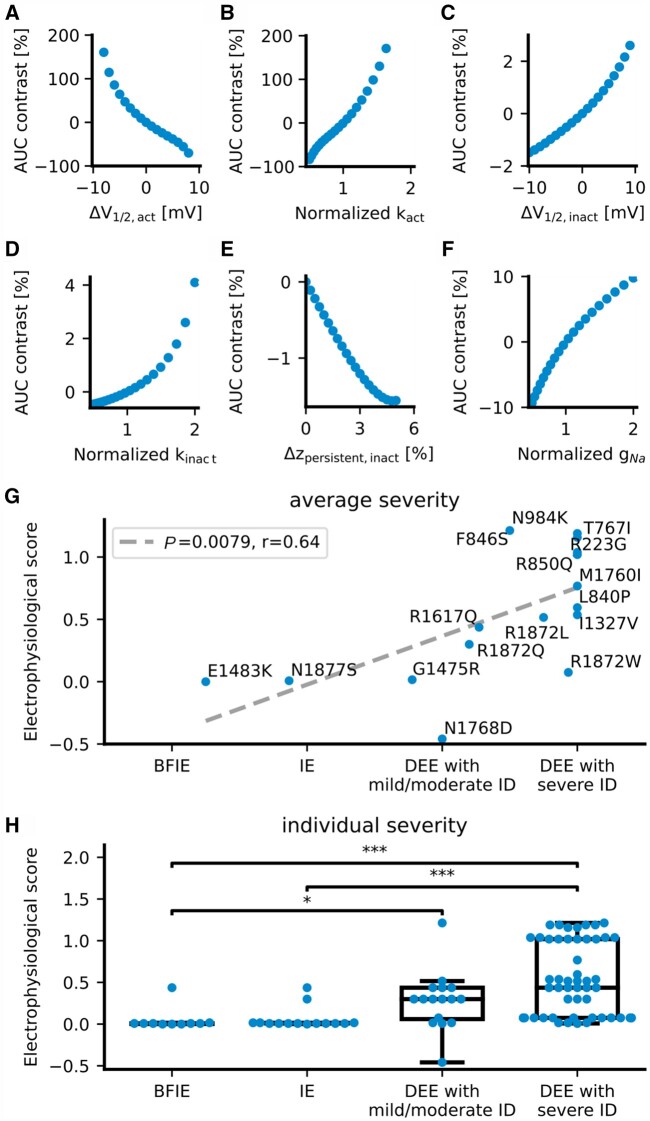
Figure 5.
Correlation of a computed electrophysiological score with the clinical severity of SCN8A GOF variants. Electrophysiological scores of SCN8A GOF variants were obtained according to the effect of variants on action potential firing simulated by a single-compartment conductance-based model. (A–F) The contrast of the simulated area under the input-output curve (AUC, Equation 1) as a function of the changes in single Na+ current gating parameters, such as: (A) the V1/2 of the activation curve; (B) the slope factor k of the activation curve; (C) the V1/2 of the fast inactivation curve; (D) the slope factor k of the fast inactivation curve; (E) the persistent Na+ current; and (F) the Na+ conductivity (or current density). Changes in the V1/2 and the slope of the activation curve had a much stronger effect on the AUC than other parameters. (G) Correlation (dashed grey line) of the simulation-based score (Equation 9) with the severity of each SCN8A GOF variant averaged over affected individuals (blue dots with the respective one-amino acid code). (H) Distributions of simulation-based scores of each patient (blue dots) for each of the four categories of clinical severities. *P < 0.05; ***P < 0.001 (ANOVA on ranks with Dunn’s post hoc test).

