Figure 4.
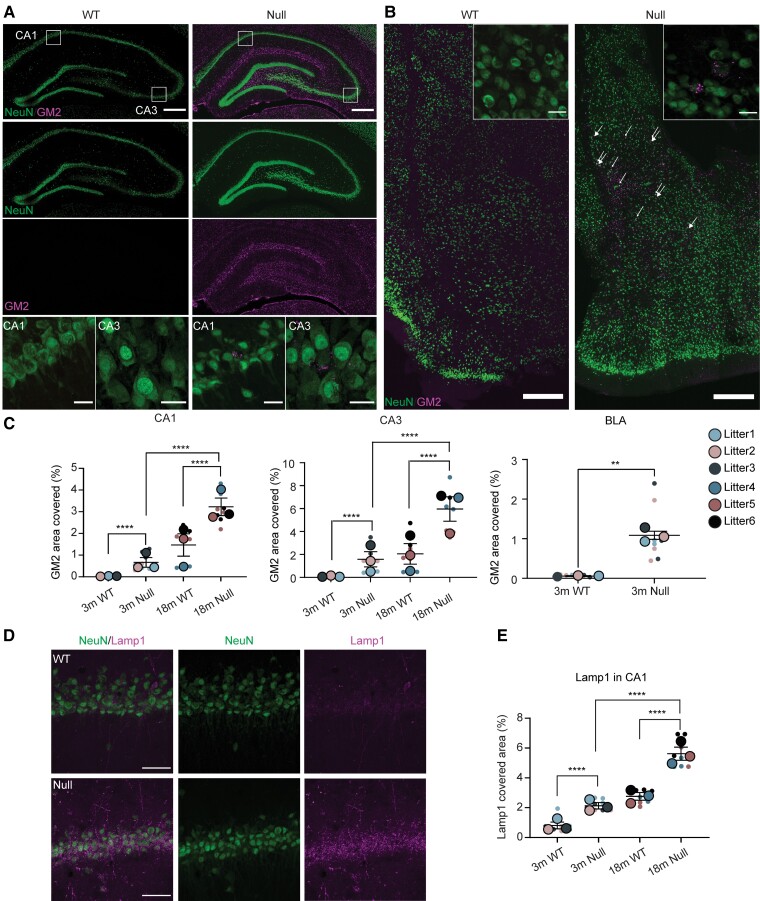
Lysosomal defects in NHE6-null rats. (A) GM2 ganglioside staining in the CA1 and CA3 of wild-type (WT) and NHE6-null rats at 3 months. Coronal brain sections were stained with GM2 (magenta) along with NeuN (green). In the CA1 and CA3 region, GM2 prominently accumulates in neurons of NHE6-null rats compared to wild-type. White boxes in the merged images indicate the location of magnified GM2 images. Scale bar = 500 µm; scale bar for magnified images = 50 µm. (B) GM2 staining in basolateral amygdala (BLA) region of wild-type and NHE6-null rats at 3 months. Brain sections were stained with GM2 (magenta) and NeuN (green). GM2 was detected in neurons in NHE6-null rats. The GM2 staining was prominently detected in neurons in NHE6-null rats. Arrows indicates GM2-accumulating neurons. Insets show GM2-positive neuron cells. Scale bar = 500 µm; scale bar for insets = 50 µm. (C) Quantification of GM2 covered area (%) in CA1 (P < 0.0001), CA3 (P < 0.0001) and BLA (P = 0.0006) regions of wild-type and NHE6-null rats from 3 and 18 months. Two-way ANOVA was performed followed by Tukey’s honestly significant difference (HSD) (wild-type = 3, Null = 3 for each time point). For BLA, unpaired t-test with Welch’s correction was conducted. (D) Lamp1 (lysosomal marker) staining with NeuN in wild-type and NHE6-null rats at 3 months and 18 months. The Lamp1 staining in the CA1 region and other regions increases in neurons of NHE6-null rats compared to wild-type. Scale bar= 50 µm. (E) Quantification of Lamp1 covered area (%) at 3 and 18 months (P < 0.0001). Two-way ANOVA was conducted followed by Tukey’s HSD (wild-type = 3, Null = 3 for each time point). Values from each brain section (three sections/each animal) are clustered in different colour codes according to each animal and plotted as a small dot. Means from each biological replicate are overlaid on the top of the full dataset as a bigger dot. P-value and SEM were calculated using values from all sections from all animals used in biological replicates. All data are presented as mean ± SEM.

