Figure 6.
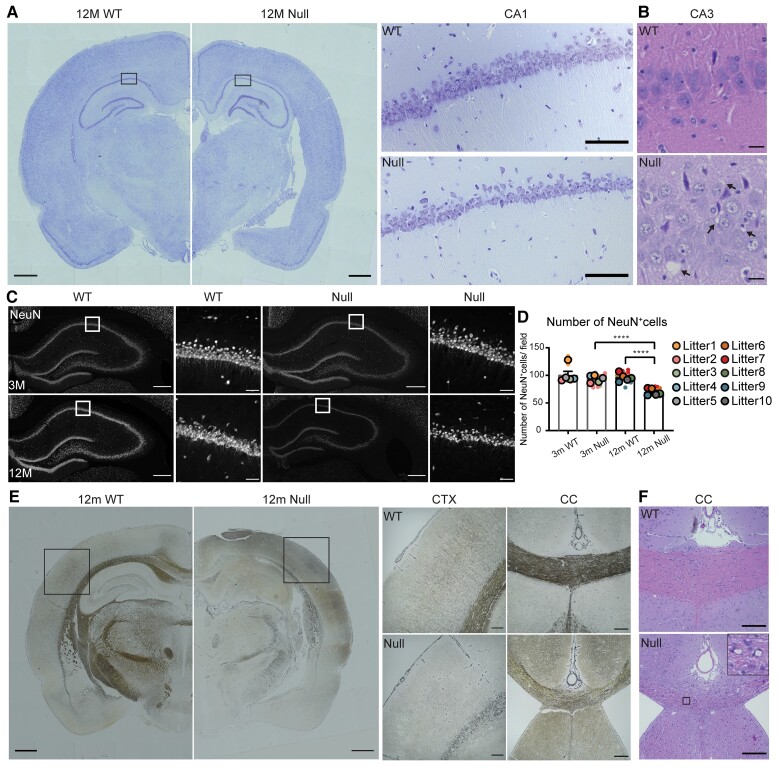
Neuronal loss and axonal pathology in NHE6-null rats. (A) Representative images of 12-month-old wild-type (WT) and NHE6-null rat brain sections stained with Nissl. The overall brain size of NHE6-null rat decreased. Enlarged ventricles and loss of piriform/entorhinal CTX were observed. Boxes indicate the location of the magnified hippocampal images. In the CA1 region, the Nissl staining decreased in NHE6-null rats. Scale bar for the whole brain image = 500 µm; magnified image = 200 µm. Quantification for volumes of the hippocampus (HP), the piriform/entorhinal CTX, and the lateral ventricle, cortical layer thickness and dentate gyrus thickness is presented in Supplementary Fig. 3. (B) Haematoxylin and eosin staining in the CA3 region of HP from 12-month-old wild-type and NHE6-null rats. Multifocal vacuolization was observed in NHE6-null rats. Scale bar = 20 µm. Arrows indicate vacuoles. (C) Representative images of NeuN staining. Brain sections from wild-type and NHE6-null rats at 3 and 12 months were stained with a neuronal marker, NeuN. White boxes indicate the location of magnified images. Scale bar for the whole hippocampal image = 200 µm; magnified images = 50 µm. (D) Quantification of number of NeuN-positive cells in the CA1 region of wild-type and NHE6-null rats at 3 and 12 months. At 12 months, the number of NeuN-positive cells decreased in NHE6-null rats compared to 12-month-old wild-type and 3-month-old NHE6-null rats. Two-way ANOVA was performed followed by Tukey’s HSD (wild-type = 5, Null = 5 for each time point). Tukey’s adjusted P = 0.0062 (Null at 3 months versus Null at 14 months), P = 0.0028 (wild-type at 12 months versus Null at 12 months). Values from each brain section (four sections/each animal) were clustered in different colour codes according to each animal and plotted as a small dot. Means from each biological replicate are overlaid on the top of the full dataset as a bigger dot. P-value and SEM were calculated using values from all sections from all animals used in biological replicates. All data are presented as mean ± SEM. Asterisks represent P-values as follows: *P ≤ 0.05, **P ≤ 0.01, ***P ≤ 0.001, ****P < 0.0001. (E) Bielschowsky’s silver staining of 12-month-old wild-type and NHE6-null rats. The staining of cortical region and major axonal tracks including corpus callosum (CC) are reduced in NHE6-null rats. Boxes indicate the location of the magnified cortical images. In CTX, the staining was barely detected in NHE6-null rats. Thinning of CC was observed in NHE6-null rats. Scale bar for the whole brain image = 500 µm; magnified image= 200 µm. (F) Haematoxylin and eosin staining of 12-month-old wild-type and NHE6-null rats. Multifocal vacuolization of the CC and adjacent grey matter was observed in NHE6-null rats. Insets represent the magnified image of vacuolization. Scale bar = 200 µm.

