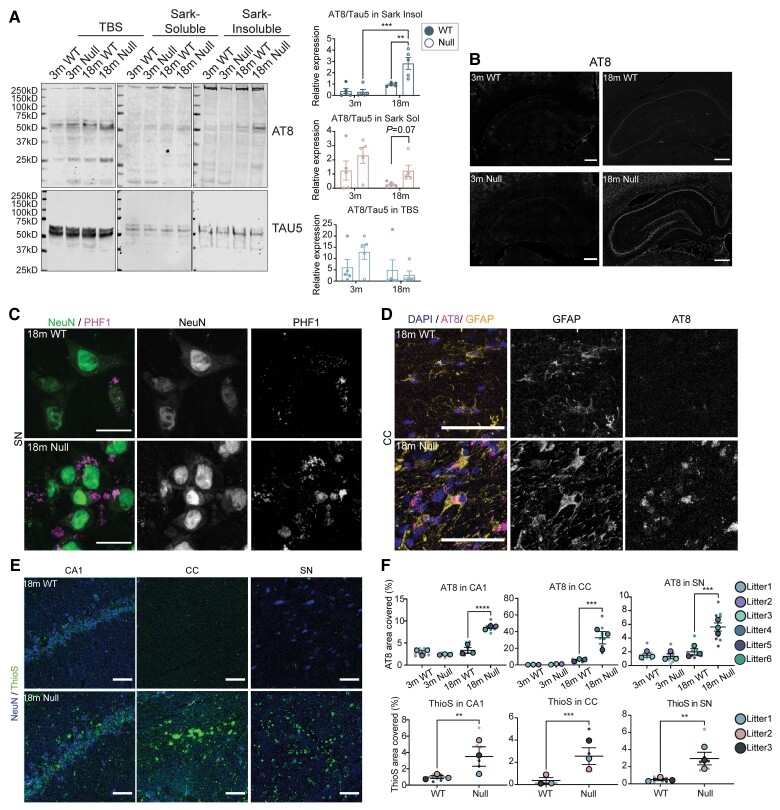
Figure 7.
Tau-associated pathologies in the aged brains of NHE6-null rats. (A) Brain tissue from NHE6 wild-type (WT) and null rats at 3 months and 18 months were sequentially extracted in TBS, sarkosyl-containing buffer and urea-containing buffer. The whole lanes of AT8 and TAU5 were used for quantification. Representative western blot images of tau fractionation are shown. For quantification of tau fractionation, densitometry of AT8 and TAU5 was measured, using the signal present in the entire lane. Data are expressed as AT8 signal relative to TAU5 signal. The insoluble AT8 fraction increased in NHE6-null rats compared to wild-type at 18 months (P = 0.0027 for wild-type versus Null at 18 months, P = 0.00034 for Null at 3 versus 18 months). Two-way ANOVA with Tukey’s HSD was performed (wild-type = 5, Null = 5 for each time point). (B) AT8 immunostaining in the HP and CTX region at 18 months. The overall increase in AT8 staining was exhibited in NHE6-null rats. Scale bar = 500 µm. (C) PHF1 and NeuN staining in the SN region of wild-type and NHE6-null rats at 18 months. PHF1-positive NeuN staining was observed in NHE6-null rats. Scale bar = 20 µm. (D) AT8 and GFAP staining in the CC region of wild-type and NHE6-null rats at 18 months. AT8 and GFAP-positive staining was profoundly detected in NHE6-null rats. Arrow indicates AT8/GFAP-positive stained cells. Scale bar = 20 µm. (E) ThioflavinS (ThioS) staining from wild-type and NHE6-null rats at 18 months. Prominent ThioflavinS staining was detected in the CA1, CC and SN regions of NHE6-null rats. (F) Quantification of AT8 covered area (%) in the CC (P = 0.0009), SN (P = 0.0008) and CA1 (P < 0.0001) regions of wild-type and NHE6-null rats at 3 and 18 months was calculated. Two-way ANOVA followed by Tukey’s HSD was conducted. Also, ThioflavinS covered area (%) n the CC (P = 0.0007), SN (P = 0.0011) and CA1 (P = 0.0072) at 18 months was quantified. Two-tailed unpaired t-test with Welch’s correction was performed. Values from each brain section (three sections/each animal) are clustered in different colour codes according to each animal and plotted as a small dot. Means from each biological replicate are overlaid on the top of the full dataset as a bigger dot. P-value and SEM were calculated using values from all sections from all animals (wild-type = 3, Null = 3) used in biological replicates. All data are presented as mean ± SEM. Data are presented as mean ± SEM. Asterisks represent P-values as follows: *P ≤ 0.05, **P ≤ 0.01, ***P ≤ 0.001, ****P ≤ 0.0001.

