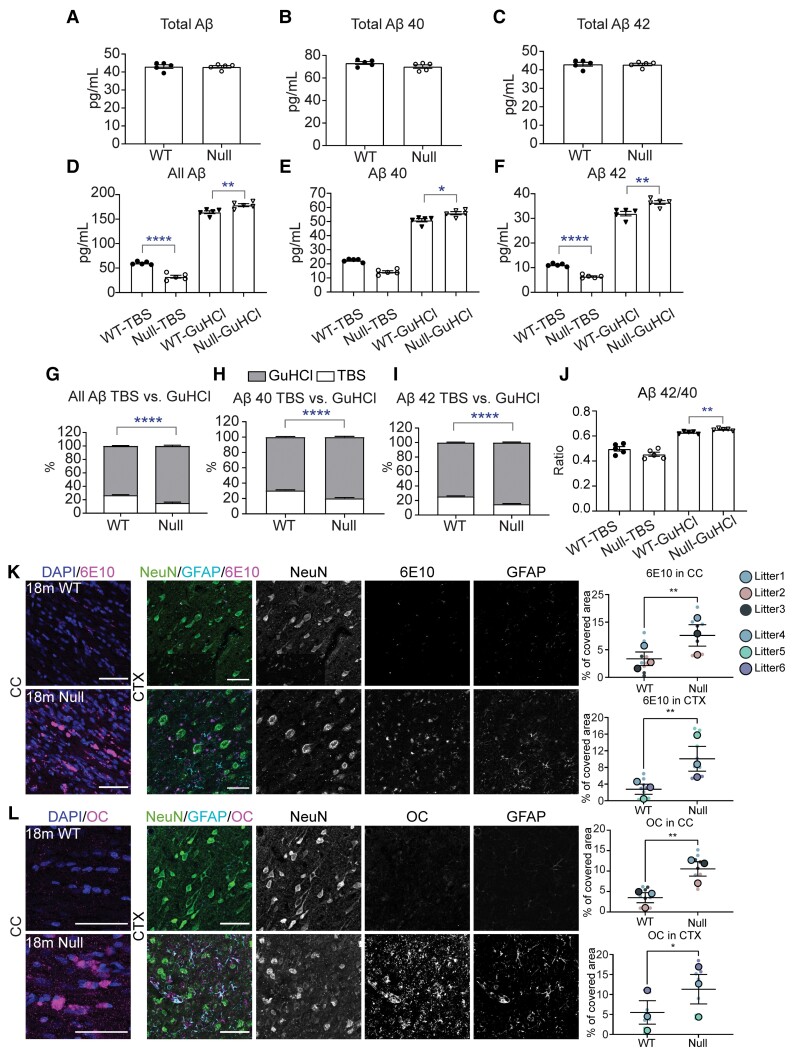
Figure 8.
Aggregation of amyloid-β in NHE6-null rats without an increase in overall amyloid-β level. (A–C) The level of amyloid-βs including amyloid-β38, amyloid-β40 and amyloid-β42 did not change from wild-type (WT) and NHE6-null rats at 18 months. (D–F) GuHCl-soluble fractions in all amyloid-β, amyloid-β40 and amyloid-β42 from NHE6-null rats increased while TBS-soluble fractions decreased. (G–I) A proportion of GuHCl-soluble fraction increases while TBS-soluble fraction decreases in all amyloid-β, amyloid-β40 and amyloid-β42. (J) Ratio of amyloid-β42/40 increase in GuHCl-soluble fraction (wild-type = 5, Null = 5). All statistical analysis details described in detail in the main text and Supplementary Table 3. (K and L) APP/amyloid-β staining in the CC and CTX region of wild-type and NHE6-null rats at 18 months. Increase in 6 ×10¹⁰ and fibrillar amyloid-β oligomer (clone: OC) was detected in NHE6-null rats. Two-tailed unpaired t-test with Welch’s correction was performed (wild-type = 3, Null = 3). Values from each brain section (three sections/each animal) are clustered in different colour codes according to each animal and plotted as a small dot. Means from each biological replicate are overlaid on the top of the full dataset as a bigger dot. P-value and SEM were calculated using values from all sections from all animals used in biological replicates. All data are presented as mean ± SEM. Data are presented as mean ± SEM. Asterisks represent P-values as follows: *P ≤ 0.05, **P ≤ 0.01, ***P ≤ 0.001, ****P ≤ 0.0001.

