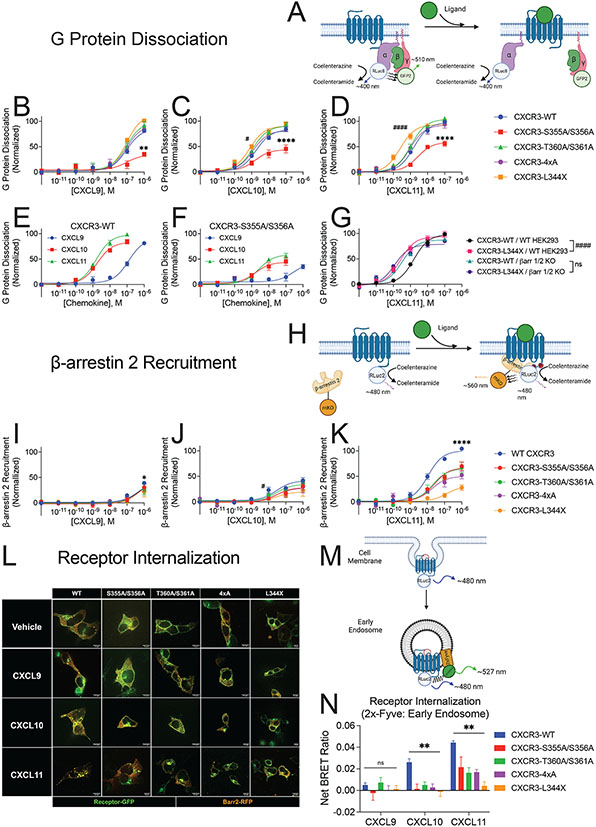
Figure 2: G protein dissociation, β-arrestin 2 recruitment, and receptor internalization of CXCR3 and receptor mutants.
(A) Schematic of BRET2-based TRUPATH assay to detect G protein dissociation following agonist treatment43. (B, C, and D) G protein dissociation of receptors treated with listed chemokine in HEK293 cells. (E and F) G protein dissociation of CXCR3-WT and CXCR3-S355A/S356A in HEK293 cells. (G) G protein dissociation of CXCR3-WT and CXCR3-L344X in wild-type HEK293 cells (WT HEK293) and β-arrestin-1/2 knock out cells (βarr 1/2 KO). (H) Schematic of BRET assay to detect β-arrestin 2 recruitment to the receptor. (I, J, and K) β-arrestin 2 recruitment of receptors treated with listed chemokine in HEK293 cells. (L) Representative confocal microscopy images of HEK293 cells transfected with receptor-GFP and β-arrestin 2-RFP following the indicated treatment for 45 minutes. Images are representative of three biological replicates. (M) Schematic of BRET assay to detect receptor internalization to endosomes. (N) BRET data of receptor internalization following stimulation with the listed chemokine. Data are the average of Net BRET values from 20-30 minutes following ligand stimulation. For (A-G) TRUPATH assays, data shown are the mean ± SEM of BRET values 5 to 10 minutes following ligand stimulation, n=3. * denotes statistically significant differences between Emax of specified receptor and CXCR3-WT. # denotes statistically significant differences between EC50 of specified receptor and CXCR3-WT. For β-arrestin 2 recruitment, data shown are the mean ± SEM of BRET values 2 to 5 minutes following ligand stimulation, n=3. *denotes statistically significant differences between EMax of CXCR3-WT and all other receptors at CXCL11, and of CXCR3-WT and CXCR3-4xA at CXCL9. # denotes statistically significant differences between EC50 of CXCR3-WT and CXCR3-S355A/S356A at CXCL10. For internalization BRET assays (N), data are the mean ± SEM of BRET values 20-30 minutes following 100 nM ligand stimulation, n=4. *P<.05 by two-way ANOVA, Dunnett’s post hoc testing between CXCR3-WT and all other receptor mutants. See S2 and S3 for further data assessing G protein dissociation, β-arrestin 2 recruitment, and receptor internalization.

