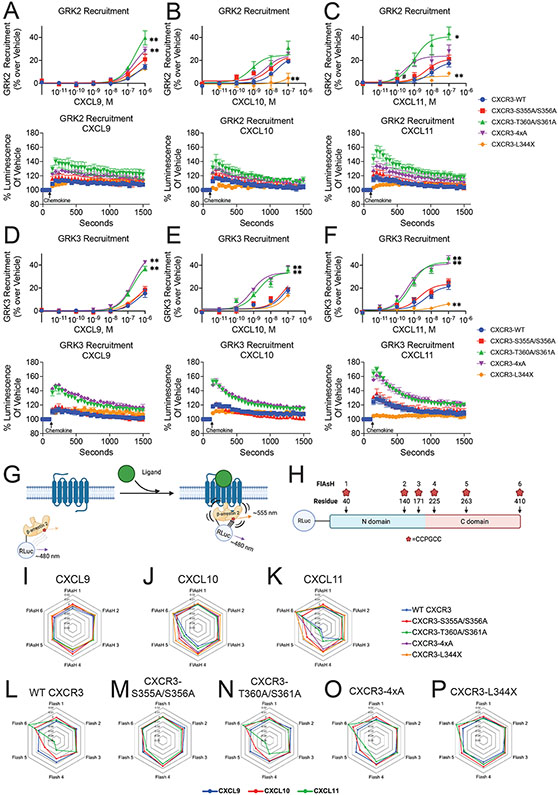
Figure 3: GRK Recruitment and β-arrestin 2 conformational dynamics.
Agonist dose-dependent data and kinetic data of saturating chemokine treatment of (A-C) GRK2 and (D-F) GRK3 recruitment to receptor as measured by luminescence from split nanoluciferase complementation of receptor and kinase. Data are grouped by treatment condition. Mean ± SEM of luminescence 2 to 5 minutes following ligand stimulation, n=3-4. Kinetic data are of the maximum dose of chemokine studied. (G) Schematic of FlAsH assay to detect β-arrestin 2 conformational dynamics following receptor stimulation using intramolecular BRET. (H) Location of N-terminal RLuc and CCPGCC FlAsH-EDT2 binding motifs on β-arrestin 2. (I-K) Radar plots of FlAsH 1-6 grouped by treatment. (L-P) Radar plots of FlAsH 1-6 grouped by receptor. Mean, n=5. For FlAsH BRET (I-P), data is the average of five consecutive reads taken approximately 10 minutes after adding chemokine (100 nM). See S4-S5 for additional GRK recruitment data and S6 for raw FlAsH data.

