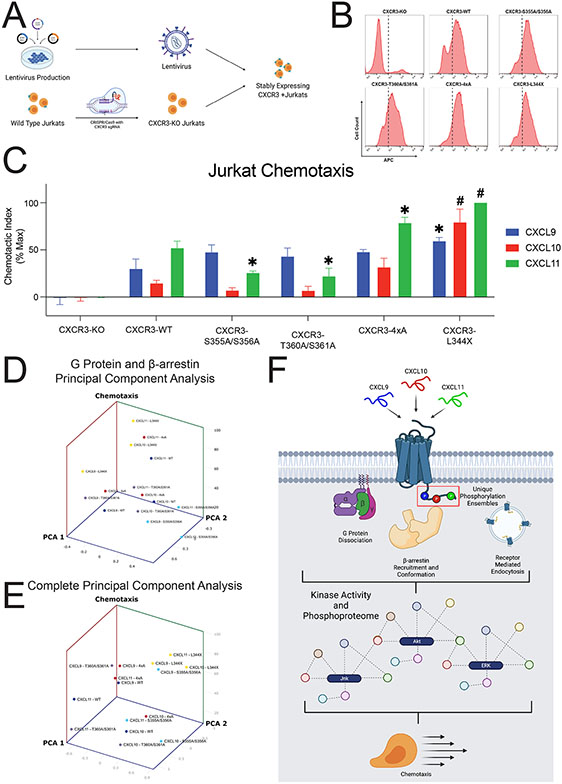
Figure 7: Jurkat chemotaxis and model of the phosphorylation barcode.
(A) Schematic of lentiviral production carrying cDNA for CXCR3-WT or one of the four receptor mutants, generation of CXCR3-KO Jurkats using CRISPR/Cas9, and creation of stably expressing CXCR3 Jurkats. (B) Surface expression of CXCR3-KO Jurkats or five various Jurkat cell lines transduced with lentivirus carrying the listed receptor cDNA as measured with flow cytometry. Dotted line denotes a fluorescence intensity of 102. For transduced cells, cells with a fluorescence intensity greater than 102 were sorted for chemotaxis experiments. (C) Jurkat chemotaxis for each receptor/ligand combination. Jurkat cells were serum starved for four hours and then allowed to migrate towards the indicated chemokine (10nM) for five hours. Mean ± SEM, n=4. *P<.05 by two-way ANOVA, Tukey’s post hoc testing denotes comparisons between a specific ligand/receptor combination to the same ligand at CXCR3-WT. (D) Principal Component Analysis of G Protein activation and β-arrestin 2 recruitment versus chemotaxis. (E) Principal Component Analysis of G Protein activation, β-arrestin 2 recruitment, GRK2 and GRK3 recruitment, and FlAsH versus chemotaxis. See S9 for chemotaxis data grouped by receptor and univariate analyses. (F) Working model for biased ligand generation of unique barcode ensembles which differentially regulate G protein signaling, β-arrestin recruitment and conformation, receptor endocytosis, kinase activity, the global phosphoproteome, and cellular functions such as chemotaxis.

