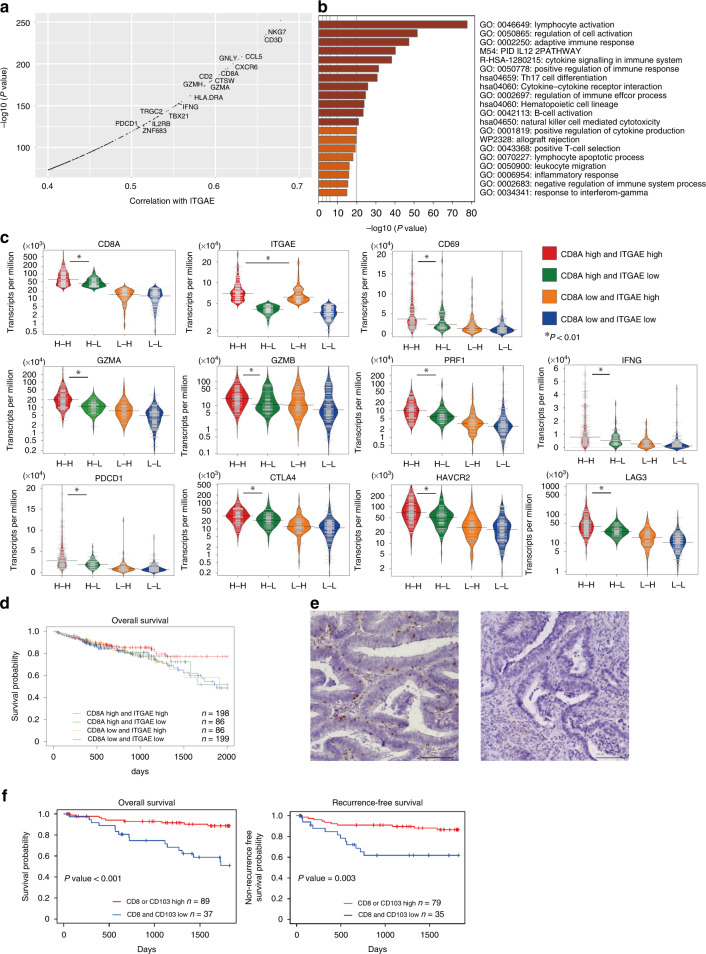
Fig. 1. CD103, which drives Trm cell generation, correlates with lymphatic activation in CRC.
a ITGAE-correlated genes encoding CD103 in TCGA-COAD and TCGA-READ. b Bar graph showing enriched terms across the gene sets correlated with ITGAE (correlation coefficient >0.4), coloured by P values. c Bean plots of cytotoxic cytokines, immune checkpoint molecules, and Trm cells are considered core genes of CRC in TCGA. The genes were categorised according to the median mRNA expression of CD8A and ITGAE as cut-off values into high CD8A and high ITGAE (H–H), high CD8A and low ITGAE (H–L), low CD8A and high ITGAE (L–H), and low CD8A and low ITGAE (L–L) groups. d Kaplan–Meier curve of OS for the four groups. e Immunohistochemical staining for CD103 at invasive margins of resected CRC tissue (left: high invasion; right: low invasion). f Kaplan–Meier curves of OS and RFS by CD103+ and CD8+ cell count. Trm cells tissue-resident memory T cells, CRC colorectal cancer, ITGAE integrin subunit alpha E, TCGA The Cancer Genome Atlas, COAD colon adenocarcinoma, READ rectum adenocarcinoma, mRNA messenger RNA, OS overall survival, RFS recurrence-free survival.

