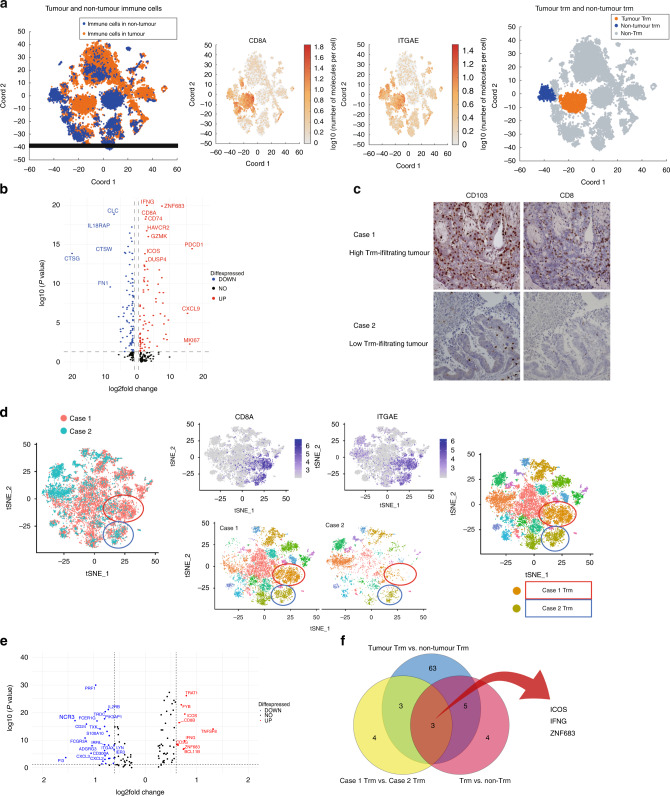
Fig. 3. Characteristics of cancer-specific Trm cells in CRC.
a t-SNE plots of singlet-gated CD45+ single-cell transcriptomes obtained from resected CRC and adjacent normal colon tissue and gene expression of ITGAE and CD8A. Tumour Trm (orange) and non-Trm (blue) cell clusters are defined according to ITGAE and CD8A expression. b Volcano plot showing the DEGs between Trm and non-Trm cell clusters. c Immunohistochemical staining of CRC tissues at the invasive margins; CD103 staining of Case 1 (high invasion; upper left), CD8 staining of Case 1 (high invasion; upper right), CD103 staining of Case 2 (low invasion; lower left) and CD8 staining of Case 2 (low invasion; lower right). d t-SNE plots of singlet-gated CD45+ single-cell transcriptomes obtained from Trm high- and low invasion cases of resected CRC. High (orange) and low (dark yellow) Trm invasion are defined according to ITGAE and CD8A expression. e Volcano plot showing DEGs between Case 1 and Case-2 Trm cell clusters. f Venn diagram of upregulated genes in Fig. 2e, tumour Trm cells, and high invasion Trm cells. Trm cells tissue-resident memory T cells, CRC colorectal cancer, ITGAE integrin subunit alpha E, t-SNE t-distributed stochastic neighbour embedding, DEG differentially expressed gene.

