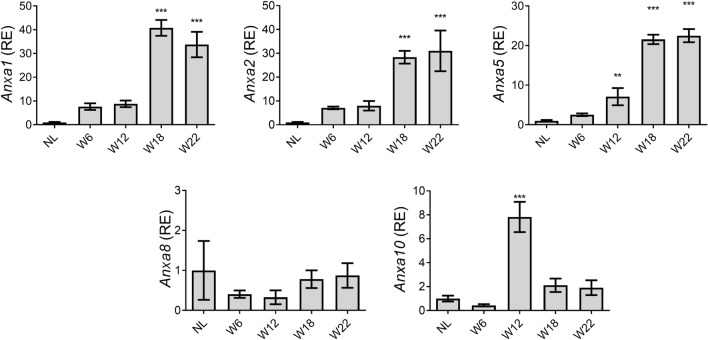
Figure 1.
Expression of Anxa1, Anxa2, Anxa5, Anxa8, and Anxa10 genes during rat hepatocarcinogenesis. The relative mRNA levels of annexin genes in liver tissue were determined by RT-qPCR. Anxa1, Anxa2, Anxa5, Anxa8, and Anxa10 expression was normalized to ribosomal 18 s mRNA level. Bars show the relative expression (RE) compared to the NL group and represent the mean ± SD. p values were calculated by the ANOVA test. n = 5 animals/group. NL normal liver, W week. ***p < 0.001; **p < 0.01.

