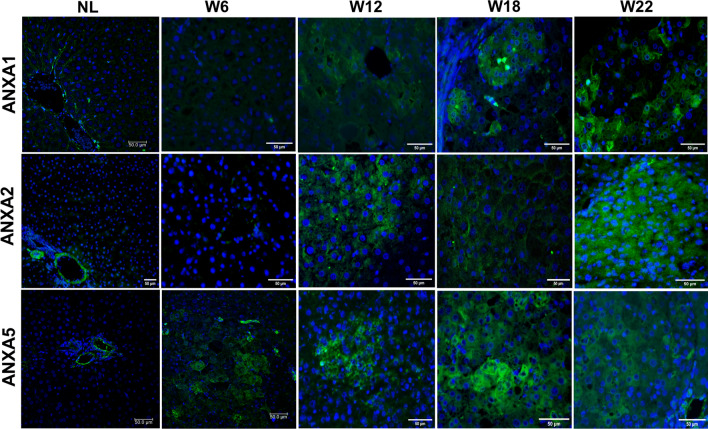
Figure 3.
Increased annexins in cells of nodules during hepatocarcinogenesis. Representative images of ANXA1, ANXA2, and ANXA5 expression in NL tissue, preneoplastic lesions (W6 and W12), and HCC tumor cells (W18 and W22) were obtained by IF analysis. Annexin proteins were labeled with Alexa Fluor 488 (green), while nuclei were stained with DAPI (blue). Magnification: 400X. Scale bar = 50 μm. n = 5 animals/group. Images were captured with ZEISS Axio-A1 Microscopy.

