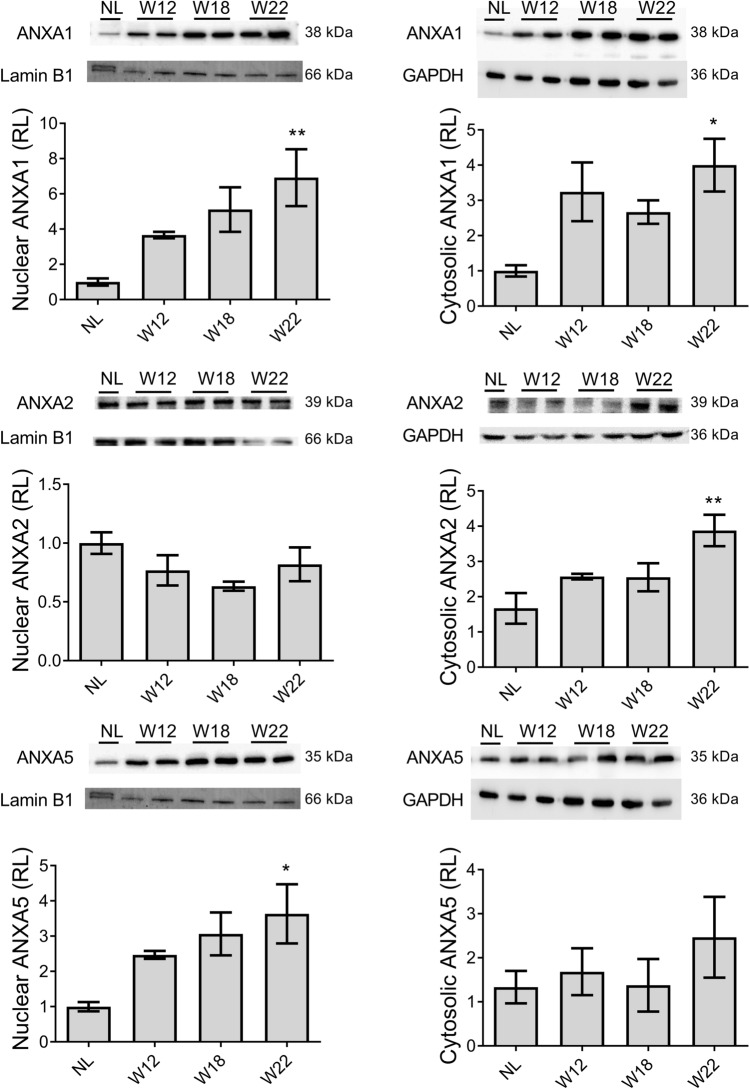
Figure 4.
Subcellular expression levels of ANXA1, ANXA2, and ANXA5 proteins. The graphs show nuclear and cytosolic protein expression in liver samples from all experimental groups normalized to Lamin B1 and GAPDH, respectively. Bars show the relative levels (RL) compared to the NL group and represent the mean ± SD. p values were calculated by the ANOVA test. n = 3 animals/group. NL normal liver, W week. **p < 0.01; *p < 0.05. Images were captured with the Uvitec MINI HD6 photo-documentation system. Original blots of figure are presented in Supplementary Information S1.

