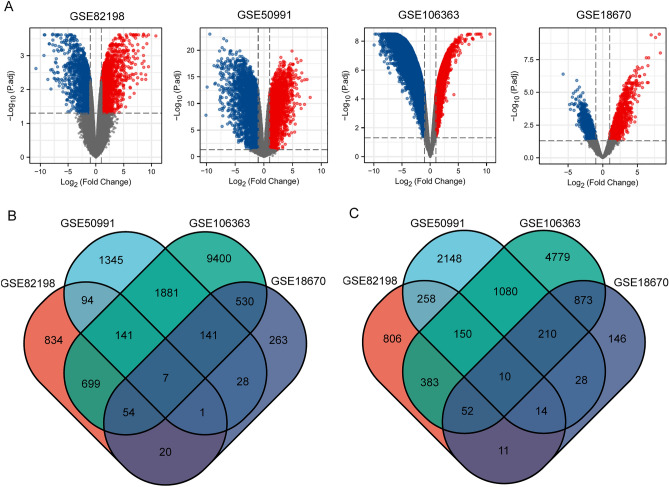
Figure 1.
Differentially expressed genes in CTCs. (A) Differentially expressed genes in different datasets. (B) Venn diagram of up-regulated DEGs in CTCs. (C) Venn diagram of down-regulated DEGs in CTCs. The red and blue dots represent up-regulated and down-regulated genes, respectively. The threshold for fold change > 1.0 and a corrected p-value of < 0.05. Black points represent genes with no significant difference. GEO gene expression omnibus, DEGs differentially expressed genes.

