Figure 10.

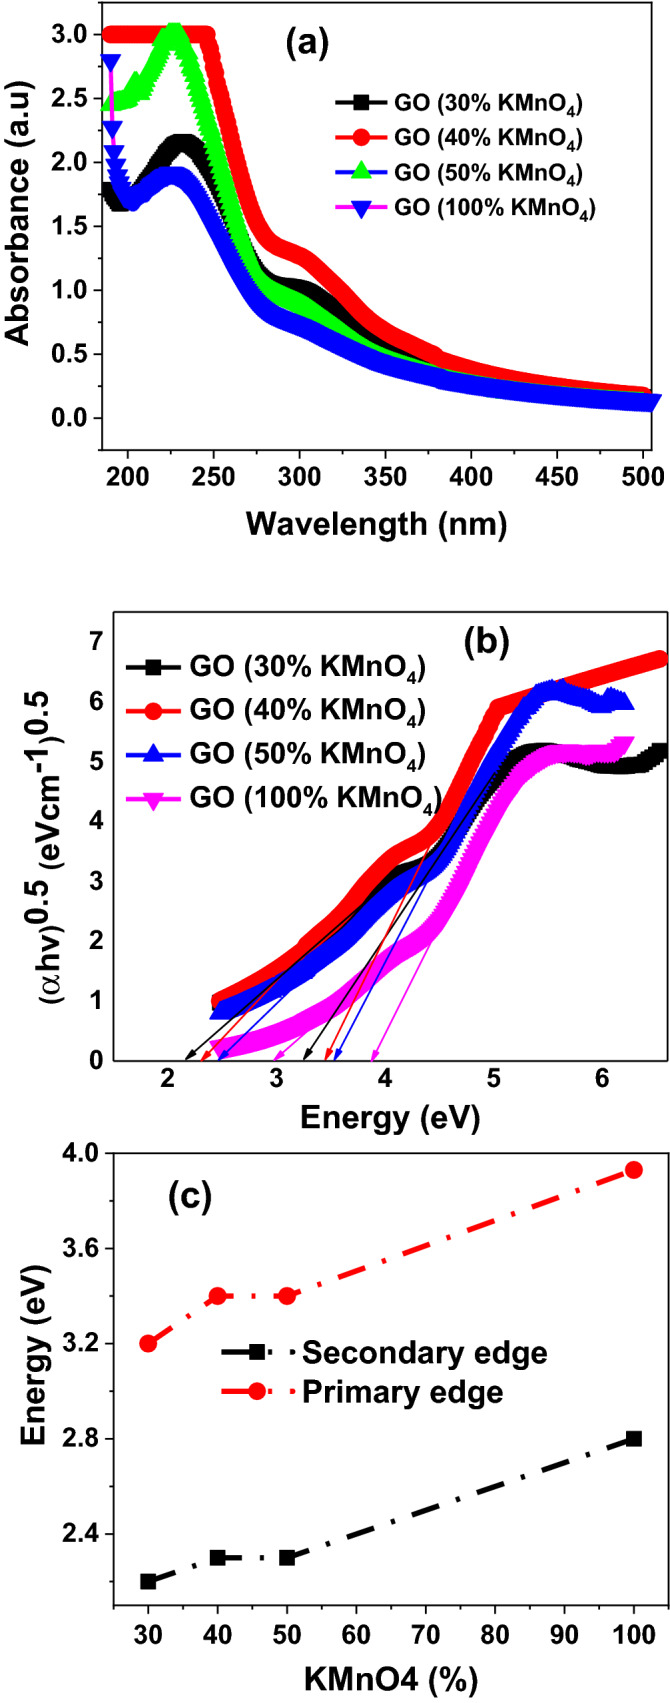
(a) Absorption spectra of controlled oxidized GO nanosheet samples (b) Tauc plots of controlled oxidized GO nanosheet samples (c) Variation in optical bandgap of controlled oxidized GO nanosheet samples versus amount of oxidizing agent.

(a) Absorption spectra of controlled oxidized GO nanosheet samples (b) Tauc plots of controlled oxidized GO nanosheet samples (c) Variation in optical bandgap of controlled oxidized GO nanosheet samples versus amount of oxidizing agent.