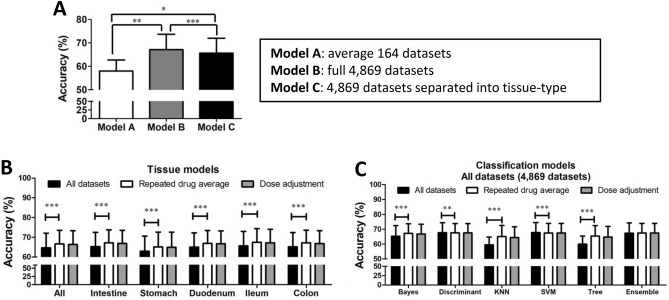
Figure 2.
Model comparisons. (A) The prediction accuracy of models built using different dataset preparations for refined selected-AEs (n = 10–13); (B) the prediction accuracy of different tissue models. ‘All’ column indicates average of all four-tissue-type (n = 2016) and ‘intestine’ column indicates average of three intestinal segments except stomach (n = 1554), stomach and ileum (n = 462), duodenum and colon (n = 546); (C) the prediction accuracy of model trained using different classification algorithms (n = 336). Data represents the mean ± S.D. Significant differences are indicated as *p < 0.05, **p < 0.01, ***p < 0.001 using paired t-tests.

