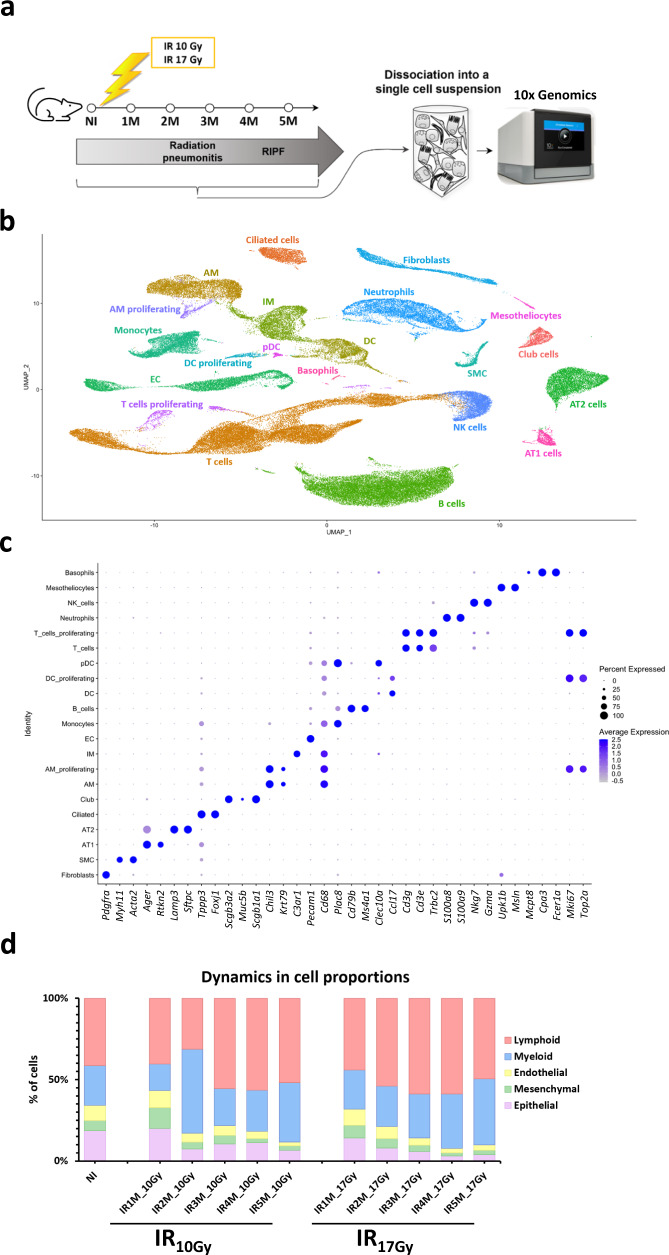
Fig. 1. Radiation-induced lung injury cell atlas.
a Scheme of the experimental set up. Mice are irradiated with a dose of 10 Gy or 17 Gy and monitored by CT-scan to follow the development of pulmonary fibrosis. Mice are sacrificed at 1, 2, 3, 4, and 5 months after IR, and lungs are enzymatically and mechanically dissociated into a single cell suspension before being loaded in the 10x Chromium Controller System (image provided by 10x Genomics). b UMAP visualization of 102,869 cells from 20 different samples (5 NI; 5 IR10Gy, one per time point; 10 IR17Gy, two per time point) annotated by cell type. c Dot plot of the expression of the markers used for cell type identification. d Dynamics in cell proportions of the endothelial, mesenchymal, epithelial, lymphoid, and myeloid cells across the NI and IR conditions at the different time points and doses.

