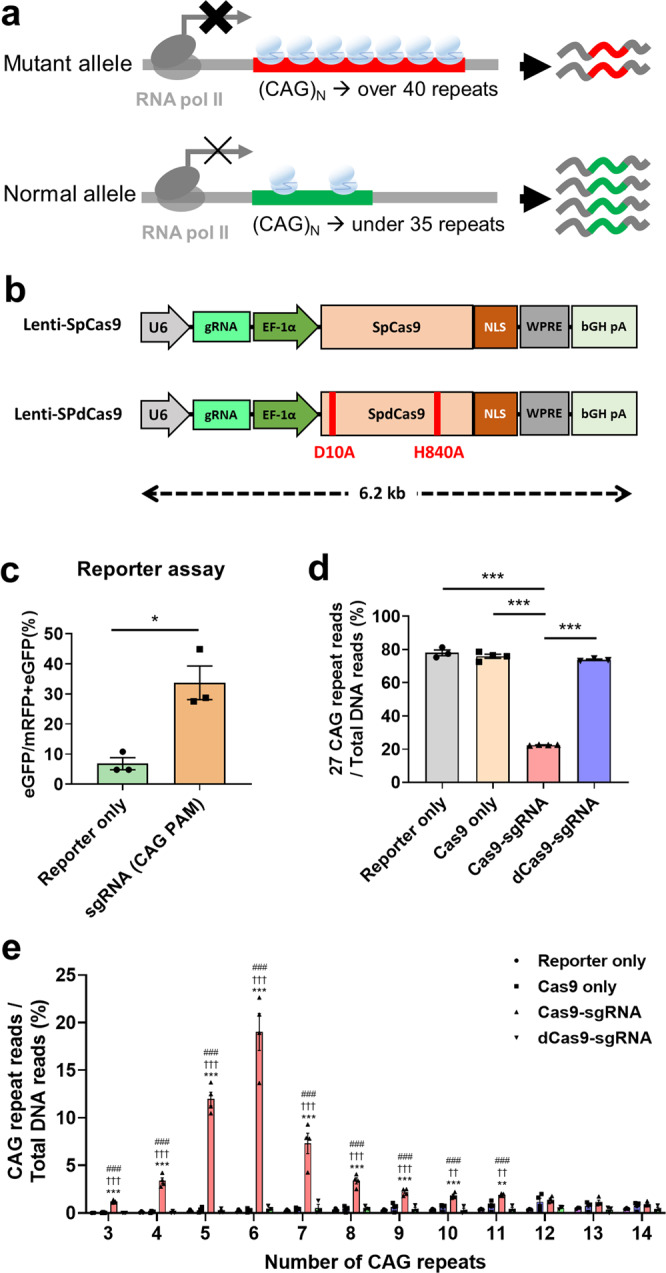
Fig. 1. The sgRNA with CAG as PAM sequence reduces the number of CAG repeats.

a Schematic illustrating the expected phenotypes according to the relative repression of HTT. A CRISPRi was designed to bind to the polyglutamine tract and aims to reduce mHTT expression without altering CAG repeat length. Relative repression between the mutant allele and normal allele is caused by the different number of CAG repeats. Cas9 complexes bind to the mutant allele more than the normal allele due to the elongated polyglutamine stretch. b Schematic representation of the lentiviral vector containing indicated components. U6: human U6 polymerase III promoter; EF1a: elongation factor 1a promoter; NLS: nuclear localization signal; WPRE: posttranscriptional regulatory element; bGHpA: bovine growth hormone polyadenylation signal. c Flow cytometry of HEK293T cells 3 days after co-transfection of a plasmid encoding both the SpCas9 with sgRNA(CAG PAM) targeting CAG repeats and the surrogate reporter, or surrogate reporter only. Frameshift generated by indels can read to eGFP expressions changing out-of-frame to in-frame codons from mRFP expressions. The percentage of eGFP+/mRFP+eGFP+ cells is indicated that Cas9 with CAG-targeting sgRNA (CAG PAM) is highly efficient compared with Reporter only-treated cells (n = 3, each). Error bars represent the mean ± S.E.M. **P < 0.01, by independent t-test. d In HEK293T cells 3 days after co-transfection of plasmid including Reporter only (n = 3), Cas9 only (n = 4) with reporter, Cas9-sgRNA (n = 4) with reporter or dCas9-sgRNA (n = 3) with reporter. we deep sequenced the target CAG repeat region and observed that treatment with Cas9-sgRNA, but not the other groups including dCas9-sgRNA-treated cells, significantly reduced the number of repeats. Normalized ratio of DNA sequencing reads with 27 repeats of CAG. e Distribution of reduced CAG repeats caused by each experiment group. The x-axis indicates the number of CAG repeats. Error bars represent the mean ± S.E.M. **P < 0.01 and ***P < 0.001 versus Rep.+dCas9-sgRNA; ††P < 0.01 and †††P < 0.001 versus Rep.+Cas9 only; ##P < 0.01, ###P < 0.001 versus Reporter only, by one-way ANOVA with Bonferroni comparison.
