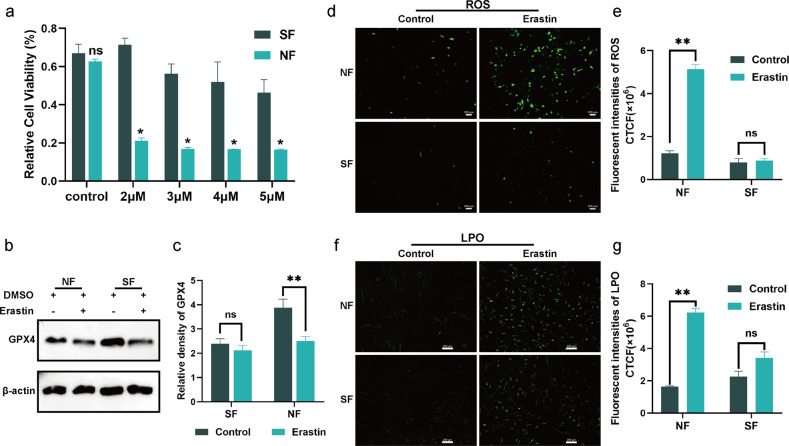
Fig. 2. Senescent fibroblasts exhibit a ferroptosis-resistant phenotype.
a Relative cell viability of erastin (2, 3, 4, 5 μΜ) -stimulated fibroblasts. b Protein level of GPX4 after 5 μΜ erastin treatment. c Quantification of GPX4 immunoblotting in b. d, f Intracellular ROS and LPO level in fibroblasts with the indicated treatment. Scale bar in d = 200 μm, Scale bar in f = 100 μm. e, g Quantification of ROS and LPO level in d and f. Data represent the mean ± SEM of triplicates. *P < 0.05; **P < 0.01; ns nonsignificant, NF normal fibroblast, SF senescent fibroblast, CTCF corrected total cell fluorescence.

