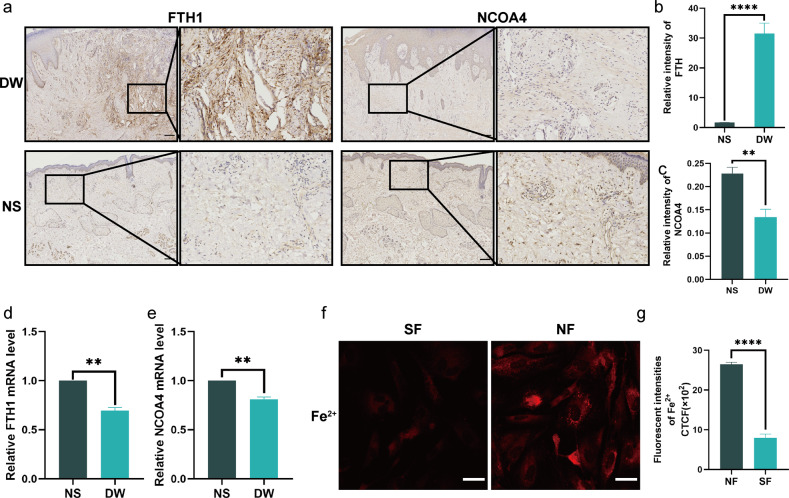
Fig. 3. Diabetes wounds exhibit impaired ferritin degradation.
a Immunohistochemistry staining of FTH1 and NCOA4 in DW and NS. Scale bar = 200 mm. b, c Quantification of FTH1 and NCOA4 immunostaining in a. d, e The mRNA level of FTH1 and NCOA4 were detected by real-time PCR in DW and NS. f Intracellular free iron ions in fibroblasts. Scale bar = 50 μm. g Quantification of intracellular free iron ions in f. Data represent the mean ± SEM of triplicates. **P < 0.01; ****P < 0.0001. DW diabetes wounds, NS normal skin, NF normal fibroblast, SF senescent fibroblast, CTCF corrected total cell fluorescence.

