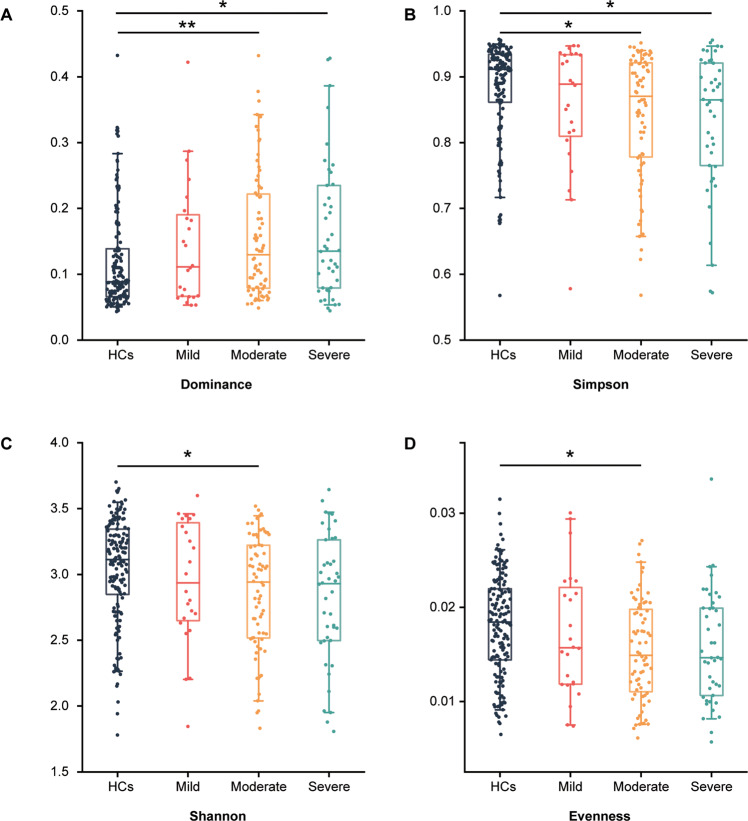
Fig. 1. The α-diversity index analysis among HCs and MDD subgroups.
A–D The box plots showing α-phylogenetic diversity analysis results, the dominance index increased in moderate and severe groups relative to HCs while simpson was decreased, while there was no significant difference between mild and HCs. In moderate group, the shannon and evenness indexes were significantly lower than that in HCs. (HCs, n = 155; mild, n = 24; moderate, n = 72; severe, n = 42; *p < 0.05; **p < 0.01; Kruskal–Wallis rank sum test).

